Artículo: Estudio de viabilidad de una fábrica de pan árabe
Estudio de viabilidad de una fábrica de pan árabe
Estudio de viabilidad de una fábrica de pan árabe
Estudio de viabilidad profesional para una fábrica de pan árabe de tamaño pequeño a mediano que produce pan de pita, pan plano para sándwiches, pan árabe integral y paquetes minoristas de marca blanca. Debido a que no se proporcionaron datos sobre el país, el estado del edificio, las cotizaciones de proveedores, el plan de rutas o la combinación de empaques, este informe utiliza supuestos de planificación transparentes en USD que deben localizarse antes de la aprobación de la inversión.
1. Resumen ejecutivo
El proyecto es una fábrica de pan árabe diseñada en torno a una línea automática de pan plano que produce aproximadamente 10,000 unidades/hora con un peso promedio de 60 g por unidad. El caso base asume 8 horas de operación/día, 300 días/año, un 90% de rendimiento vendible después de pérdidas por horneado, rechazos y devoluciones, y una producción vendible anual de 1,296 toneladas. El plan de productos incluye pan de pita, pan plano para sándwiches, pan árabe integral y paquetes de marca blanca para supermercados, restaurantes, escuelas y distribuidores.

Utilizando un precio de venta promedio en fábrica de 1450 USD/tonelada y un costo variable de 760 USD/tonelada, una inversión total de 780,000 USD y un aumento de la utilización del 50% al 90%, los ingresos del Año 5 alcanzan los 1.69 millones de USD y el beneficio neto del Año 5 alcanza los 401,114 USD. El modelo base produce un VAN de 427,342 USD con una tasa de descuento del 12% y una TIR del 29.1%. La utilización del punto de equilibrio es del 33.0%. El proyecto es financieramente positivo bajo los supuestos establecidos, pero la aprobación final depende del costo de la harina, el costo del combustible, la densidad de la ruta diaria, el control de la vida útil, el estado del edificio y las cotizaciones de maquinaria confirmadas.
2. Alcance y metodología del estudio
Este estudio de viabilidad cubre el concepto del proyecto, el análisis del producto, los indicadores económicos y la ubicación del proyecto, los indicadores del mercado objetivo, la demanda, la producción local, las advertencias sobre importación y exportación, el análisis de la competencia, la brecha de mercado, el DAFO, el marketing, los precios, la distribución, la maquinaria, la capacidad de producción, las cotizaciones de proveedores, los costos de materia prima, los gastos operativos, los servicios públicos, el personal, la inversión, la financiación, los estados financieros, los indicadores, el punto de equilibrio, la sensibilidad, los requisitos legales/reglamentarios, la salud y seguridad ambiental, el riesgo, el cronograma de implementación, las fuentes, la consulta y la conclusión final.
La metodología combina el contexto agrícola y de estándares respaldado por fuentes, fórmulas de capacidad transparentes, supuestos prácticos de costos de maquinaria, un modelo financiero a cinco años y pruebas de sensibilidad. Las fuentes de la FAO y el Codex proporcionan el contexto de las materias primas y los estándares alimentarios, mientras que los costos de maquinaria e inversión se tratan como estimaciones de planificación presupuestaria en lugar de cotizaciones finales de proveedores [1][2][3][4][5].
3. Concepto y naturaleza del proyecto

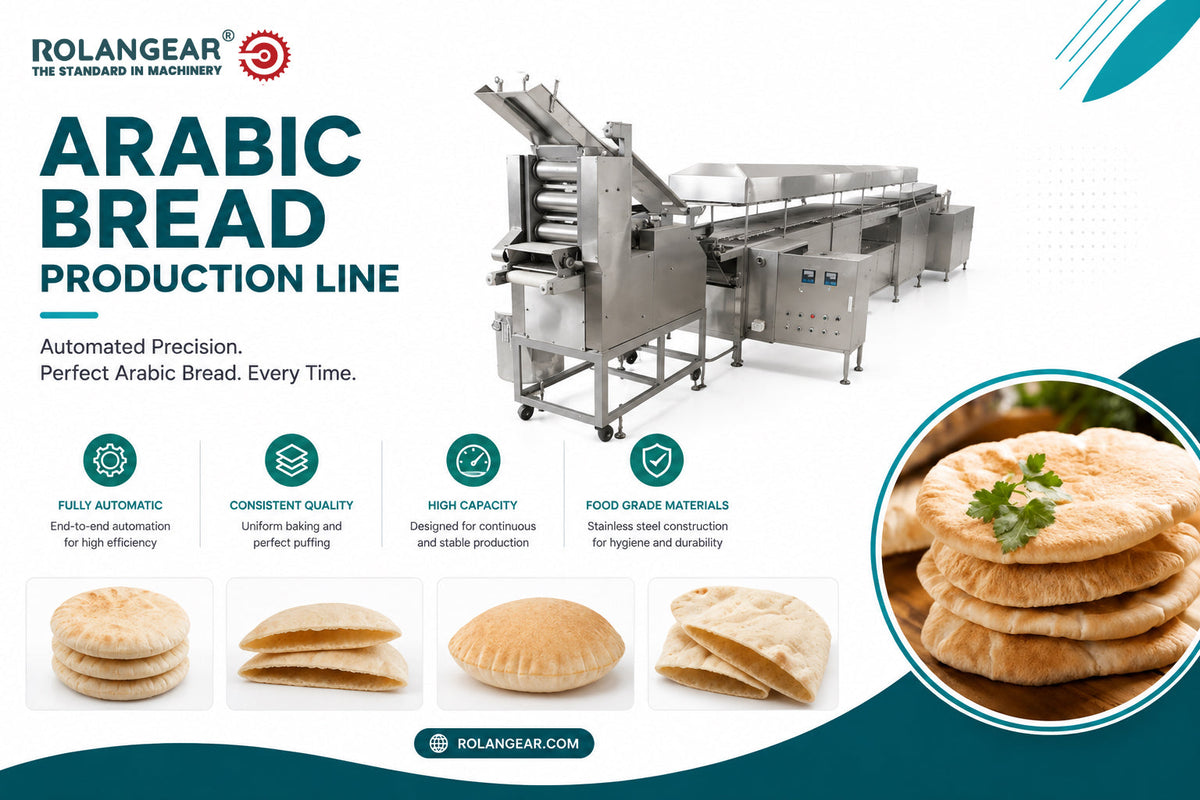
La naturaleza del proyecto es una panadería industrial y una planta de producción de alimentos básicos. La harina y los ingredientes se mezclan en masa, se dividen, se redondean, se reposan, se laminan, se fermentan donde sea necesario, se hornean rápidamente a alta temperatura, se enfrían, se cuentan, se empacan, se codifican y se despachan. El modelo de negocio combina el suministro diario de pan local, la distribución a HORECA/restaurantes, el pan envasado al por menor y la producción de marca blanca.
4. Análisis del producto y tabla de especificaciones del producto
Los productos principales son el pan árabe y el pan plano estilo pita. La formulación del producto, el etiquetado nutricional, las declaraciones de alérgenos, la vida útil, la humedad, la tolerancia al peso y las normas de envasado deben verificarse localmente. El Codex proporciona el contexto de las normas alimentarias y de harina de trigo, pero este estudio no afirma la certificación verificada del producto [2].
| Producto | Paquete típico | Canal objetivo | Notas de calidad/almacenamiento |
|---|---|---|---|
| Pan árabe / pan de pita | 5-10 unidades por bolsa | Minoristas, supermercados, hogares | Textura suave, formación de bolsa, frescura y calidad del sellado |
| Pan de pita pequeño / pan de sándwich | Bolsas pequeñas para minoristas / cajas HORECA | Restaurantes, tiendas de shawarma, cafeterías | Diámetro uniforme y resistencia al doblado |
| Pan árabe integral | Canales minoristas y orientados a la salud | Supermercados y compradores especializados | Nivel de salvado, suavidad y control de la vida útil |
| Pan plano de marca blanca | Bolsas y cajas específicas del minorista | Supermercados y distribuidores | Etiqueta, receta y número de unidades específicos del comprador |
5. Indicadores económicos y ubicación del proyecto
La ubicación debe seleccionarse en función del acceso a la harina, las rutas de distribución diarias, la fiabilidad de los servicios públicos, la ventilación de la sala de panadería, la disponibilidad de mano de obra y el suministro de empaques. Dado que el pan árabe se vende normalmente fresco, la proximidad a las rutas minoristas y los restaurantes es más importante que para los productos de larga vida útil.
| Factor de ubicación | Peso | Condición preferida | Efecto de viabilidad |
|---|---|---|---|
| Acceso a harina e ingredientes | 25% | Suministro fiable de harina de trigo, levadura, sal, azúcar/aceite y embalaje | Mayor efecto en el margen y la continuidad diaria |
| Rutas de distribución diarias | 22% | Cerca de supermercados urbanos, restaurantes y rutas de reparto matutinas | Crítico porque el pan tiene una vida útil corta |
| Servicios públicos | 16% | Energía estable, combustible para horno de gas/diésel/eléctrico, agua y aire comprimido | Afecta al coste de horneado y al tiempo de inactividad |
| Adecuación del edificio | 14% | Sala de panadería apta para alimentos, ventilación y acceso de expedición | Reduce el riesgo de instalación |
| Disponibilidad de mano de obra | 9% | Operadores, panaderos, empacadores y personal de entrega disponibles | Apoya la producción temprana por la mañana |
| Embalaje y cajas | 8% | Bolsas de plástico, clips, cajas/embalajes disponibles localmente | Protege la frescura |
| Entorno regulatorio | 6% | Requisitos claros de seguridad alimentaria y etiquetado | Reduce el retraso en el lanzamiento |
6. Indicadores del mercado objetivo
Los indicadores del mercado objetivo incluyen el consumo de pan en el hogar, los restaurantes y tiendas de shawarma, la demanda escolar/institucional, la disponibilidad en estanterías de supermercados, la capacidad de panaderías locales y las alternativas de pan plano importado/congelado. La previsión del proyecto se basa en la capacidad porque no se proporcionaron datos del mercado del país.
| Capa de mercado | Definición | Tratamiento de planificación |
|---|---|---|
| TAM | Toda la demanda de pan árabe, pita, pan plano y panadería diaria en el país objetivo | No totalmente disponible para el proyecto |
| SAM | Demanda alcanzable a través de rutas diarias planificadas, supermercados, HORECA e instituciones | Requiere validación de ruta y distribuidor |
| Mercado realista obtenible | Volumen que una nueva planta puede capturar en cinco años | Limitado por la frescura, el precio, la densidad de la ruta y la confianza del minorista |
| Previsión de ventas del proyecto | Rampa de 50% a 90% de utilización | Limitado por una capacidad vendible de 1,296 toneladas/año |
7. Análisis de la demanda

La demanda debe calcularse utilizando la población × el consumo diario de pan, el número de restaurantes y supermercados, los compromisos de ventas a nivel de ruta y el potencial de sustitución de importaciones/congelados. En este modelo preliminar, las ventas esperadas siguen la fórmula: 10,000 unidades/hora × 60 g × 8 horas/día × 300 días/año = 1,440 toneladas de producción bruta. Producción vendible = 1,440 × 90% de rendimiento = 1,296 toneladas/año. Ventas del año 1 = 1,296 × 50% = 648 toneladas.
La confianza es media para la fórmula de capacidad y baja a media para la absorción del mercado hasta que se completen las verificaciones locales de rutas, minoristas, restaurantes y competidores.
8. Análisis de la producción local
El análisis de la producción local debe identificar las plantas industriales de pan existentes, las panaderías de barrio, las panaderías de supermercados, los proveedores de restaurantes y las alternativas de pan plano congelado/importado. La producción local exacta no se indica porque no se proporcionó ningún país objetivo; debe investigarse con datos industriales oficiales, información de asociaciones de panadería, verificaciones en estanterías y entrevistas con distribuidores.
9. Análisis de importación y exportación con advertencias sobre códigos HS
Los códigos HS probables incluyen el HS 1905 para pan, pastelería, tartas, galletas y otros productos de panadería. Este código es amplio y puede incluir muchos productos más allá del pan árabe, por lo que los datos comerciales amplios no deben tratarse como demanda exacta de pan plano local sin la validación de las subpartidas. Las verificaciones de importación/exportación a nivel de país deben utilizar datos aduaneros, UN Comtrade o ITC Trade Map después de confirmar el alcance del código HS.
10. Análisis de la competencia
| Tipo de competidor | Ejemplos a investigar localmente | Presión competitiva | Respuesta |
|---|---|---|---|
| Grandes panaderías industriales | Marcas nacionales de pan y panadería | Alta | Competir con frescura, fiabilidad de entrega y valor del envase |
| Panaderías de barrio | Panaderías locales de pita/pan árabe | Media-alta | Usar densidad de ruta, calidad consistente y envasado minorista |
| Proveedores de restaurantes | Panaderías que suministran shawarma y cafeterías | Media | Ofrecer envases HORECA y tamaños personalizados |
| Pan plano importado/congelado | Alternativas congeladas o envasadas | Baja-media | Posicionar el suministro local fresco diario |
| Nuevos entrantes | Pequeñas panaderías y líneas semiautomáticas | Media | Asegurar contratos de harina y rutas minoristas temprano |
11. Análisis de la brecha de mercado

La brecha de mercado debe ser igual a la demanda estimada más la sustitución realista de importaciones/congelados menos el suministro local confiable de pan diario. Como faltan datos del país, la brecha no se cuantifica. En la práctica, la planta necesita vender 1,166 toneladas en el Año 5, por lo que la densidad de rutas, la fiabilidad de la entrega diaria y la retención de clientes son más importantes que asumir que la demanda nacional total está disponible.
12. Análisis DAFO
| Fortalezas | Debilidades | Oportunidades | Amenazas |
|---|---|---|---|
| El pan árabe es un producto básico diario en muchos mercados | La corta vida útil aumenta las devoluciones y la presión en las rutas | Suministro a minoristas, restaurantes, escuelas y marca blanca | Volatilidad de los precios de la harina y el combustible |
| Ciclo de producción rápido e ingredientes simples | Requiere disciplina en la distribución diaria temprana | El pan integral/saludable y los tamaños de sándwich añaden valor | Fuerte competencia de panaderías locales |
| Complejidad moderada del equipo | Las quejas por frescura pueden perjudicar las ventas repetidas | Los contratos HORECA apoyan un volumen estable | Las interrupciones de energía/combustible pueden detener el horneado |
13. Plan de marketing y promoción
El plan de marketing debe centrarse en la frescura diaria, el tamaño consistente del pan, la entrega temprana confiable, los formatos de envase para restaurantes, los contratos con escuelas/instituciones, el muestreo en ruta, los márgenes para minoristas y las ofertas de marca blanca. Los KPI incluyen las ventas diarias en ruta, la tasa de devoluciones, los puntos de venta activos, la tasa de entregas tardías, el tamaño promedio del pedido, la tasa de quejas y el margen bruto por canal.
14. Plan de precios
| Producto | Precio de planificación estándar en fábrica | Lógica de precios |
|---|---|---|
| Bolsas de pan árabe al por menor | USD 1,250–1,600/tonelada de pan terminado | Producto básico con sensibilidad al precio |
| Cajas de pan plano para restaurantes / shawarma | USD 1,300–1,700/tonelada de pan terminado | Contratos por volumen y requisitos de tamaño personalizado |
| Pan árabe integral | USD 1,600–2,000/tonelada de pan terminado | Mayor costo de ingredientes y posicionamiento premium |
| Paquetes minoristas de marca blanca | Basado en contrato | Depende de la receta, el número de bolsas, el volumen de la ruta y las condiciones de pago |
| Precio del modelo combinado | USD 1,450/tonelada de pan terminado | Utilizado para el modelo financiero base |
15. Plan de distribución
La distribución debe combinar rutas directas diarias a supermercados, restaurantes, tiendas de shawarma, grandes superficies, instituciones y mayoristas seleccionados. La gestión de devoluciones es crítica: la planificación de rutas debe equilibrar la frescura, las roturas de stock y la recogida de pan no vendido.
16. Maquinaria, equipos y costos de la línea de producción

Los costos de maquinaria se presentan como estimaciones de planificación presupuestaria para una fábrica de pan árabe de pequeña a mediana escala. El costo final del equipo debe confirmarse mediante ofertas técnicas formales basadas en el diámetro del pan, el peso por pieza, la capacidad horaria, el requisito de fermentación, el tipo de horno, el sistema de combustible, el formato de empaque, el nivel de automatización, la instalación y los requisitos del destino [3][4][5].
| Máquina / equipo | Función | Estimación de costo presupuestario del equipo |
|---|---|---|
| Manipulación de harina, tamiz y mezcladora espiral | Preparación de ingredientes y mezclado de masa | USD 35k–80k |
| Divisora, boleadora y sistema de reposo/fermentación de masa | Porcionar y relajar las piezas de masa | USD 60k–140k |
| Sistema de laminado / prensado / formación de pan plano | Formar discos redondos de pan árabe | USD 70k–160k |
| Horno de túnel u horno de cocción automático de pan de pita | Horneado a alta temperatura y formación de bolsa | USD 150k–300k |
| Transportador de enfriamiento y sistema de conteo/apilamiento | Enfriar y organizar el pan antes de empacar | USD 60k–130k |
| Línea de embolsado, cierre/sellado y codificación de fecha | Empaque minorista | USD 50k–130k |
| Detector de metales, verificador de peso y herramientas de control de calidad | Soporte de calidad y cumplimiento | USD 20k–60k |
| Servicios: compresor, sistema de combustible del horno, obras hidráulicas y eléctricas | Sistemas de soporte de fábrica | USD 70k–150k |
17. Costos de Construcción, Instalaciones y Edificación
Las instalaciones deben incluir almacenamiento de harina, sala de mezcla, área de formado de masa, zona de fermentación/reposo, sala de horno de túnel, área de enfriamiento y empaque, zona de despacho de productos terminados, almacén de empaques, área de control de calidad, sala de mantenimiento, área de higiene del personal y bahía de carga para entregas. La ventilación y la extracción de calor alrededor del horno son importantes.
18. Capacidad de Producción e Idoneidad de la Línea

La capacidad nominal es de 10 000 piezas/hora con un peso promedio de 60 g por pieza. Producción bruta anual = 10 000 × 0.06 kg × 8 horas/día × 300 días = 1440 toneladas. Producción vendible después de un rendimiento del 90 % = 1296 toneladas/año. Pueden producirse cuellos de botella en el mezclado, fermentación/reposo, formación de bolsa en el horno, tiempo de enfriamiento, velocidad de embolsado, carga de la ruta de entrega y devoluciones diarias.
19. Cotizaciones de Proveedores y Ofertas Técnicas
No se proporcionó ninguna cotización de proveedor. Las ofertas finales de los proveedores deben confirmar la capacidad por tamaño de pan, hidratación de la masa, diseño de laminado y fermentación, tipo de horno y carga energética, longitud del transportador de enfriamiento, velocidad de empaque, piezas de repuesto, instalación, capacitación, garantía e Incoterm.
20. Costos de Materias Primas

Las principales materias primas son harina de trigo, levadura, sal, agua, pequeñas cantidades de azúcar/aceite según la receta, bolsas de pan, clips, cajas/embalajes, etiquetas y consumibles de limpieza. El costo variable base es de 760 USD/tonelada de pan terminado, incluyendo harina, ingredientes, empaque, combustible para horno, mano de obra directa y devoluciones/desperdicios normales.
21. Requisitos y Gastos Operativos
Los gastos operativos fijos anuales se estiman en 230 000 USD antes de la depreciación. Esto cubre gestión, supervisión de producción, control de calidad, mantenimiento, ventas/administración, coordinación de rutas, seguros, seguridad, costos de oficina, marketing básico y gastos generales no variables.
22. Requisitos de Servicios Públicos
| Servicio | Requisito típico a confirmar | Efecto en la viabilidad |
|---|---|---|
| Electricidad | Corriente trifásica para mezcladoras, transportadores y línea de empaque | Controla el tiempo de actividad |
| Combustible para horno / gas / diésel / calefacción eléctrica | Horno de túnel y sistema de cocción | Principal factor de costo |
| Aire comprimido | Empaque y actuadores de máquinas | Afecta la estabilidad de la línea |
| Agua | Agua para masa y limpieza | Seguridad alimentaria y consistencia de la receta |
| Ventilación | Extracción de calor de la sala del horno | Apoya la productividad laboral |
| Gestión de residuos | Residuos de masa, devoluciones de productos viejos y residuos de empaque | Requisito de EHS e higiene |
23. Estructura Organizacional y de Gestión
| Rol | Número de empleados | Responsabilidad principal |
|---|---|---|
| Gerente general | 1 | Operaciones, ventas y finanzas |
| Gerente de producción / tecnólogo panadero | 1 | Coordinación de recetas, procesos, rendimiento y calidad |
| Supervisores de turno | 2 | Ejecución diaria de la producción |
| Operadores de mezclado/formado/horno | 10 | Preparación de masa, formado y horneado |
| Operadores de empaque | 10 | Embolsado, sellado y codificación de fecha |
| Personal de calidad/laboratorio | 2 | Registros de peso, humedad, sellado, higiene y liberación |
| Mantenimiento y servicios | 3 | Horno, mezcladoras, transportadores y máquinas de empaque |
| Conductores / ayudantes de ruta | 8 | Entrega diaria y recogida de devoluciones |
| Ventas/administración/finanzas | 4 | Pedidos, cuentas y servicio al cliente |
24. Costos de Inversión
| Elemento de inversión | Estimación estándar | Base |
|---|---|---|
| Acondicionamiento de edificio, ventilación, higiene y área de despacho | $140,000 | Estimación de planificación; excluye compra de terreno |
| Línea de formado, horneado, enfriamiento y empaque de pan árabe | $350,000 | Paquete presupuestario de línea de procesamiento |
| Servicios: sistema de combustible para horno, compresor, electricidad y agua | $100,000 | Subsidio para servicios auxiliares |
| Laboratorio, control de calidad, manipulación, cajas y equipo de taller | $35,000 | Equipo de apoyo |
| Flete, aranceles, instalación, capacitación y puesta en marcha | $55,000 | Subsidio dependiente del destino |
| Gastos preoperativos, permisos y lanzamiento | $25,000 | Estimación de planificación |
| Reserva para contingencias | $45,000 | Reserva aproximada |
| Capital de trabajo inicial | $30,000 | Harina, levadura, empaque, combustible y cuentas por cobrar |
| Inversión total del proyecto | $0.78m | Subtotal calculado |
25. Requisitos y Condiciones de Financiamiento

La financiación base asume un 40% de capital propio y un 60% de deuda. El requisito de capital propio es de 312 000 USD y el requisito de préstamo es de 468 000 USD. Los términos del préstamo se modelan con un interés anual del 9%, un reembolso de capital a cinco años con pagos iguales y sin período de gracia. Los términos finales dependen del prestamista, las garantías y el perfil del patrocinador.
26. Pronósticos de Ingresos y Ventas
| Año | Utilización | Volumen de ventas, toneladas | Ingresos | Beneficio neto | DSCR |
|---|---|---|---|---|---|
| A1 | 50.0% | 648 | $939,600 | $88,000 | 1.13x |
| A2 | 65.0% | 842 | $1.22m | $202,048 | 2.10x |
| A3 | 75.0% | 972 | $1.41m | $280,326 | 2.91x |
| A4 | 85.0% | 1,102 | $1.60m | $358,605 | 3.84x |
| A5 | 90.0% | 1,166 | $1.69m | $401,114 | 4.57x |
El escenario optimista asume una rápida incorporación de rutas, una utilización del 95% en el año 5 y bajas devoluciones. El escenario conservador asume una listado minorista más lento, una utilización del 75% en el año 5, un precio de venta más bajo y un mayor costo de harina/combustible.
27. Estados Financieros
| USD | A1 | A2 | A3 | A4 | A5 |
|---|---|---|---|---|---|
| Ingresos | $939,600 | $1.22m | $1.41m | $1.60m | $1.69m |
| Costo de ventas | $492,480 | $640,224 | $738,720 | $837,216 | $886,464 |
| Beneficio bruto | $447,120 | $581,256 | $670,680 | $760,104 | $804,816 |
| EBITDA | $217,120 | $351,256 | $440,680 | $530,104 | $574,816 |
| Depreciación | $65,000 | $65,000 | $65,000 | $65,000 | $65,000 |
| EBIT | $152,120 | $286,256 | $375,680 | $465,104 | $509,816 |
| Intereses | $42,120 | $33,696 | $25,272 | $16,848 | $8,424 |
| Impuestos | $22,000 | $50,512 | $70,082 | $89,651 | $100,278 |
| Beneficio neto | $88,000 | $202,048 | $280,326 | $358,605 | $401,114 |
| USD | A0 | A1 | A2 | A3 | A4 | A5 |
|---|---|---|---|---|---|---|
| Flujo de caja de capital / proyecto | -$312,000 | $59,400 | $173,448 | $251,726 | $330,005 | $372,514 |
| Flujo de caja acumulado | -$312,000 | -$252,600 | -$79,152 | $172,574 | $502,579 | $875,093 |
| Amortización de deuda principal | - | $93,600 | $93,600 | $93,600 | $93,600 | $93,600 |
| Deuda final | - | $374,400 | $280,800 | $187,200 | $93,600 | $0 |
| USD | A1 | A2 | A3 | A4 | A5 |
|---|---|---|---|---|---|
| Activos fijos netos | $495,000 | $430,000 | $365,000 | $300,000 | $235,000 |
| Capital de trabajo y efectivo | $30,000 | $30,000 | $202,574 | $532,579 | $905,093 |
| Activos totales | $525,000 | $460,000 | $567,574 | $832,579 | $1.14m |
| Deuda | $374,400 | $280,800 | $187,200 | $93,600 | $0 |
| Patrimonio y ganancias retenidas | $150,600 | $179,200 | $380,374 | $738,979 | $1.14m |
| Pasivos más patrimonio | $525,000 | $460,000 | $567,574 | $832,579 | $1.14m |
28. Indicadores Financieros y Análisis Financiero
| Indicador | Fórmula / base | Resultado base | Interpretación |
|---|---|---|---|
| Margen bruto | (Ingresos - Costo de ventas) / Ingresos | 47.6% | Saludable si se controlan la harina, el combustible y las devoluciones |
| Margen de contribución | Precio - costo variable | USD 690/ton | Usado para el punto de equilibrio |
| Cantidad de equilibrio | Costo fijo / contribución | 428 toneladas/año | Requiere 33.0% de utilización |
| ROI | Beneficio neto promedio / inversión | 34.1% | Positivo después de la fase de arranque bajo supuestos presupuestarios |
| VAN | FCFF sin apalancar descontado al 12% | $427,342 | Positivo pero sensible al precio y al volumen de la ruta | TIR | Tasa de descuento donde el VAN = 0 | 29.1% | Por encima de la tasa de descuento del 12% en el caso base |
| Recuperación de la inversión | Recuperación acumulada de efectivo con apalancamiento | Durante el año 3 | Requiere densidad de ruta y bajos retornos |
| Deuda/capital | Deuda / capital | 1.50x | Apalancamiento moderado |
| DSCR | Flujo de caja operativo / servicio de la deuda | Año 1 1.13x; Año 5 4.57x | Mejora después del aumento de la ruta |
29. Análisis de punto de equilibrio
Contribución por tonelada = precio de venta (1450) − costo variable (760) = 690 USD. Cantidad de equilibrio = costo fijo más depreciación ($295,000) ÷ contribución (690) = 428 toneladas/año. Ingresos de equilibrio = $619,928. Utilización de equilibrio = 33.0% de la capacidad vendible.
Fuente: modelo de caso base calculado, 2026.
30. Análisis de sensibilidad
| Variable probada | Resultado VAN | Impacto vs. VAN base |
|---|---|---|
| Precio de venta -10% | $44,089 | -$383,254 |
| Volumen de ventas/utilización -10% | $244,966 | -$182,376 |
| Harina y envasado +10% | $226,465 | -$200,878 |
| Gastos operativos fijos +10% | $361,014 | -$66,328 |
| Costo de capital +10% | $349,342 | -$78,000 |
| Retraso en el lanzamiento / retraso en la ruta | -$146,935 | -$574,277 |
| Precio de venta +10% | $810,596 | $383,254 |
| Costo variable -10% | $628,220 | $200,878 |
Fuente: modelo de sensibilidad calculado, 2026.
Las variables críticas son el precio de venta, el volumen diario de ventas por ruta, el costo de la harina, el costo del combustible, las devoluciones de productos y la velocidad de lanzamiento de la ruta.
31. Requisitos legales y reglamentarios
Los requisitos normalmente incluyen el registro de la empresa, la licencia de panadería o procesamiento de alimentos, la aprobación del etiquetado del producto, el plan de seguridad alimentaria, las normas de salud de los trabajadores, el registro fiscal, la seguridad contra incendios, la aprobación ambiental y el cumplimiento de los vehículos de reparto. Se requiere una revisión de la legislación alimentaria local antes de la producción [2].
32. Análisis ambiental, de salud y seguridad

Los problemas de EHS incluyen polvo de harina, calor del horno, riesgo de quemaduras, cintas transportadoras en movimiento, protección de la máquina de envasado, productos químicos de limpieza, control de plagas, devoluciones de pan rancio, residuos de envasado y seguridad contra incendios. El proyecto debe implementar controles tipo HACCP, trazabilidad, control de plagas, protección de equipos, POE de saneamiento y gestión diaria de devoluciones.
33. Análisis de riesgos y registro de riesgos
| Riesgo | Probabilidad | Impacto | Mitigación |
|---|---|---|---|
| Aumento del precio de la harina | Medio | Alto | Contratos con proveedores y revisión del precio del paquete |
| Interrupción del combustible o la energía | Medio | Alto | Energía de respaldo y planificación del combustible del horno |
| Altas devoluciones de productos | Medio | Alto | Planificación de rutas, control de vida útil y previsión de la demanda |
| Escasez de envases | Medio | Medio | Múltiples proveedores de bolsas y clips |
| Lenta adopción de rutas/distribuidores | Medio | Alto | Acuerdos de ruta previos al lanzamiento y muestreo |
| Problema de seguridad alimentaria o higiene | Bajo-medio | Alto | Controles tipo HACCP, control de plagas y trazabilidad |
34. Calendario de implementación
| Fase | Duración | Tareas clave |
|---|---|---|
| Localización de la viabilidad | 2–4 semanas | Datos del país, precios de la harina, validación de rutas |
| Ingeniería y permisos | 1–2 meses | Diseño de distribución, licencia de alimentos, servicios públicos y ventilación |
| Cotización y adquisición de proveedores | 2–3 meses | Ofertas técnicas, contrato y fabricación |
| Obras civiles y servicios públicos | 2–4 meses | Pisos, ventilación, combustible de horno, energía y área de expedición |
| Instalación y puesta en marcha | 4–8 semanas | Instalación de la línea, horneado de prueba y pruebas de envasado |
| Lanzamiento comercial | 1 mes | Incorporación de rutas, muestreo en restaurantes y aumento de entregas minoristas |
35. Fuentes y supuestos
Registro de supuestos
| Supuesto | Valor | Base | Confianza | Efecto |
|---|---|---|---|---|
| Moneda | USD | Supuesto del analista | Medio | Todas las salidas financieras |
| Capacidad de la línea | 10,000 piezas/hora × 60 g promedio × 8 horas/día × 300 días/año | Base estándar de planificación de línea de pan árabe pequeña a mediana | Medio | Capacidad |
| Rendimiento vendible | 90% después de la pérdida por horneado, rechazos y devoluciones | Estimación del analista | Medio | Ingresos y COGS |
| Producción vendible anual | 1,296 toneladas/año | Calculado a partir de la capacidad y el rendimiento | Medio | Previsión de ventas |
| Precio de venta | USD 1,450/tonelada de pan terminado | Supuesto de planificación mezclado ex-fábrica | Bajo-medio | Ingresos y margen |
| Costo variable | USD 760/tonelada de pan terminado | Harina, levadura, sal, azúcar/aceite, envases, combustible de horno y mano de obra directa | Medio | Margen bruto |
| Inversión total | USD 0.78m | Base de costos de maquinaria presupuestarios más asignaciones de fábrica | Medio | VAN, TIR y necesidad de financiación |
| Términos de la deuda | 60%, 9%, 5 años | Supuesto del analista | Bajo-medio | Flujo de caja y DSCR |
Registro de fuentes
| Ref | Organización | Fuente y URL | Datos utilizados | Fecha de acceso | Confianza |
|---|---|---|---|---|---|
| [1] | FAO | Plataforma de cultivos y agricultura FAOSTAT, https://www.fao.org/faostat/en/#data/QCL | Plataforma oficial de datos de cultivos y relacionados con el trigo; se requiere localización por país | 2026-08-05 | Alto |
| [2] | FAO/OMS Codex Alimentarius | Lista de normas, https://www.fao.org/fao-who-codexalimentarius/codex-texts/list-standards/en/ | Contexto de harina de trigo y normas alimentarias | 2026-08-05 | Alto |
| [3] | Referencia del mercado de proveedores | Revisión de precios de la línea de producción de pan de pita y árabe | Evaluación comparativa de costos de maquinaria presupuestarios para equipos de procesamiento de pan plano | 2026-08-05 | Medio |
| [4] | Referencia del mercado de proveedores | Revisión de la categoría de máquinas de pan plano | Evaluación comparativa presupuestaria de la categoría de maquinaria para la línea de formado, horneado y envasado | 2026-08-05 | Medio |
| [5] | Referencia del mercado de proveedores | Revisión de precios de la línea de producción de pan de pita | Verificación de referencia de proveedor presupuestaria; no se trata como una cotización final | 2026-08-05 | Bajo-medio |
| [6] | Cálculo del analista | Modelo transparente en este estudio | Cálculos de capacidad, inversión, ingresos, punto de equilibrio, VAN y TIR | 2026-08-05 | Medio |
36. Sección de Consulta
¿Necesita un estudio localizado de fábrica de pan árabe?
Para un informe bancable de una fábrica de pan árabe, confirme el país, el tamaño del pan, el recuento de paquetes, los precios de la harina y el combustible, el estado del edificio, el plan de ruta, los vehículos de reparto, la tasa impositiva, los términos de financiación y la cotización del proveedor. Rolangear puede apoyar la configuración de la línea de producción de pan árabe, la selección de maquinaria, la planificación de la capacidad y la comparación de cotizaciones.
Contactar con Rolangear37. Conclusión final y recomendación
La fábrica de pan árabe es técnicamente factible y financieramente positiva bajo los supuestos presupuestarios establecidos. La inversión es más atractiva cuando la planta asegura un suministro confiable de harina, controla las tasas de combustible y retorno, desarrolla rutas diarias sólidas y firma compromisos con restaurantes/tiendas de comestibles antes del lanzamiento. La recomendación es proceder a la validación localizada antes de la inversión final: confirmar los precios de la harina, los precios de venta locales, la demanda de la ruta, los costos de empaque, los costos de combustible/energía, el estado del edificio, la receta del producto y la cotización formal del proveedor.
Gráficos basados en datos
Fuente: modelo de caso base calculado, supuestos de planificación de 2026. Unidad: millones de USD.
Fuente: modelo de caso base calculado, supuestos de planificación de 2026. Unidad: miles de USD.
Fuente: modelo de caso base calculado, supuestos de planificación de 2026. Unidad: porcentaje.
Fuente: modelo de caso base calculado, supuestos de planificación de 2026. Unidad: toneladas.
Equipos: 44.9%Edificación: 17.9%Servicios: 12.8%Otros: 24.4%
Fuente: modelo de inversión presupuestario del analista, 2026.
Pan árabe al por menor: 50.0%Pan plano HORECA: 30.0%Trigo integral: 12.0%Marca blanca: 8.0%
Fuente: modelo de inversión presupuestario del analista, 2026.