Estudio de viabilidad industrial de una fábrica de bolsas de plástico
Estudio de Viabilidad para Fábrica de Bolsas Plásticas
Estudio de viabilidad profesional para una fábrica de bolsas de plástico de pequeña a mediana escala, productora de bolsas tipo camiseta, bolsas planas, bolsas de basura, bolsas para forro y bolsas impresas para minoristas. Dado que no se suministraron datos sobre país, ciudad, precio de la resina, tarifas de servicios públicos, condiciones del edificio o cotizaciones de proveedores, este informe utiliza supuestos transparentes de planificación en USD que deben ser localizados antes de la aprobación de la inversión.
Mapa de Estudio
1. Resumen Ejecutivo
El proyecto es una fábrica de manufactura de bolsas plásticas basada en extrusión de película soplada, impresión opcional, corte, sellado, perforación, conteo y empaque. El caso base asume una producción nominal de 400 kg/hora, 85% de eficiencia operativa, 20 horas/día, 300 días operativos/año y 95% de rendimiento vendible, lo que resulta en 1,938 toneladas/año de bolsas vendibles.

Utilizando un precio de venta promedio ex-fábrica de USD 1,900/tonelada, un costo variable de USD 1,350/tonelada y una inversión total de $1.10m, los ingresos del Año 5 alcanzan $3.31m y el beneficio neto del Año 5 llega a $391,414. El VAN base es de $171,145 con una tasa de descuento del 12%, la TIR estimada es del 17.2%, y la utilización de equilibrio es del 39.2%.
2. Alcance y Metodología del Estudio
Este estudio de viabilidad cubre el mercado, aspectos técnicos, operativos, organizativos, de inversión, financiación, estados financieros, indicadores, punto de equilibrio, sensibilidad, aspectos legales, EHS, riesgos, implementación, fuentes, consulta y recomendación final. Los indicadores del Banco Mundial apoyan la macroselección [1][2], el HS 3923 apoya las salvedades de clasificación comercial [3], y las fuentes de PNUMA, OCDE, UE y OSHA apoyan el contexto ambiental y de seguridad [4][5][6][7].
3. Concepto y Naturaleza del Proyecto
El proyecto es una fábrica de conversión de plásticos de industria ligera a mediana. Los gránulos de resina son extruidos en rollos de película, impresos cuando es necesario, convertidos en bolsas, empacados y distribuidos a clientes minoristas, mayoristas, de servicios de alimentos, industriales e institucionales. El modelo es principalmente el suministro de envases domésticos con potencial de sustitución de importaciones, no un negocio de exportación garantizado.
4. Análisis de Producto y Tabla de Especificaciones del Producto

La mezcla de productos incluye bolsas genéricas y semipersonalizadas. Las especificaciones deben confirmarse por tamaño, grosor, grado de resina, color, impresión, formato de rollo o paquete y categoría permitida de bolsa de plástico.
| Producto | Especificación típica | Cliente objetivo | Notas de calidad |
|---|---|---|---|
| Bolsas tipo camiseta para compras | HDPE/LDPE, 12–35 micras, asas perforadas | Tiendas de comestibles y minoristas | Resistencia del asa, calidad del sellado, precisión del conteo |
| Bolsas planas | Múltiples tamaños, transparentes o de color | Panaderías, textiles, tiendas de repuestos | Sellado limpio y claridad |
| Bolsas de basura | Rollos de LDPE/LLDPE, 30–100 micras | Hogares, empresas de limpieza, instituciones | Resistencia a la perforación y perforación del rollo |
| Bolsas para forro | Grandes forros industriales/para contenedores | Fábricas, hoteles, almacenes | Capacidad de carga y resistencia a fugas |
| Bolsas impresas para minoristas | Impresión flexográfica de 1 a 4 colores | Cadenas minoristas/marcas privadas | Adhesión y registro de tinta |
5. Indicadores Económicos y Ubicación del Proyecto
La demanda de bolsas plásticas sigue la actividad minorista, el volumen de servicios de alimentos, la gestión de residuos, la producción manufacturera y la distribución de empaques. Los datos de valor agregado manufacturero y población del Banco Mundial deben usarse una vez que se seleccione un país [1][2].
| Factor | Peso | Condición preferida | Efecto |
|---|---|---|---|
| Suministro de resina y logística | 24% | Cerca de distribuidores de resina o puertos | Controla el costo del material y el capital de trabajo |
| Fiabilidad eléctrica | 20% | Energía trifásica estable | Protege el tiempo de actividad de la extrusión |
| Zonificación industrial | 16% | Zona industrial ligera aprobada | Reduce el riesgo de licencias |
| Densidad de rutas de clientes | 14% | Cerca de minoristas y distribuidores | Mejora el costo de entrega |
| Mano de obra y mantenimiento | 10% | Operadores y técnicos disponibles | Soporta turnos |
| Ecosistema de residuos/reciclaje | 9% | Compradores de chatarra o reciclaje interno | Mejora el rendimiento |
| Espacio de expansión | 7% | Espacio para segunda línea | Soporta el crecimiento |
6. Indicadores del Mercado Objetivo con Separación TAM, SAM y Mercado Realistamente Obtenible
| Capa | Definición | Tratamiento de planificación |
|---|---|---|
| TAM | Todos los envases plásticos flexibles locales, bolsas de venta al por menor, bolsas de basura y forros | No totalmente disponible para el proyecto |
| SAM | Clientes alcanzables por el equipo de ventas de la fábrica y las rutas de entrega | Validar con distribuidores locales |
| Mercado obtenible de forma realista | Volumen que un nuevo participante puede ganar en cinco años | Limitado por contratos, crédito y calidad |
| Pronóstico de ventas del proyecto | Aumento a 1,744 t/año para el Año 5 | Pronóstico basado en la capacidad, no en la cuota de mercado |
7. Análisis de la Demanda
Dado que no se proporcionó un país, este informe utiliza una demanda basada en la capacidad. Fórmula: 400 kg/hora × 85% de eficiencia × 20 horas/día × 300 días/año × 95% de rendimiento = 1,938 toneladas/año. Las ventas del Año 1 son 969 toneladas y las del Año 5 son 1,744 toneladas. La demanda local debe verificarse posteriormente utilizando el consumo aparente: producción local + importaciones − exportaciones, además de entrevistas con minoristas, compradores de servicios de alimentos y distribuidores de envases.
8. Análisis de la Producción Local

El análisis de la producción local debe identificar fábricas de película soplada, convertidores, impresores de envases flexibles, productores de bolsas recicladas, productores informales y grandes grupos de envases. Las bolsas de productos básicos suelen enfrentar una fuerte competencia de precios; las bolsas impresas para minoristas, las bolsas de basura y los forros institucionales pueden mejorar el margen si la calidad es constante.
9. Análisis de Importación y Exportación con Advertencias del Código HS
La clasificación probable incluye el SA 3923 para artículos de plástico para el transporte o embalaje de mercancías; las bolsas y sacos se suelen capturar bajo el SA 3923.21 o 3923.29 según el polímero y el arancel nacional [3]. El SA 3923 es amplio y puede incluir cajas, sacos, bolsas, cierres y otros artículos de embalaje, por lo que los datos comerciales no deben tratarse como una demanda exacta de bolsas de compras sin la validación de la subpartida.
10. Análisis de la Competencia
| Tipo de competidor | Ejemplos para investigar localmente | Presión | Respuesta |
|---|---|---|---|
| Grandes plantas de embalaje flexible | Fábricas integradas de película, impresión y bolsas | Alta | Competir a través del tiempo de entrega y tamaños de nicho |
| Pequeños convertidores de bolsas | Talleres locales de extrusión/corte | Alta | Mejorar la consistencia y la entrega |
| Bolsas acabadas importadas | Proveedores regionales y comerciantes | Media-alta | Ofrecer inventario local y trabajos personalizados |
| Sustitutos | Bolsas de papel, tejidas y reutilizables | Media | Diversificar en calibres y forros permitidos |
| Nuevos participantes | Operadores de máquinas usadas | Media | Asegurar resina y clientes temprano |
11. Análisis de la Brecha del Mercado

La brecha del mercado debe ser igual a la demanda estimada menos el suministro local fiable, ajustada por importaciones, exportaciones, categorías de productos restringidas y sustitución. En este modelo preliminar, el proyecto necesita vender 1.744 toneladas para el Año 5; esto debe validarse con compromisos de compra de distribuidores y muestreos de cadenas minoristas.
12. Análisis DAFO
| Fortalezas | Debilidades | Oportunidades | Amenazas |
|---|---|---|---|
| Proceso simple y amplia base de clientes | Los márgenes de los productos básicos pueden ser reducidos | Las bolsas de marca propia y de basura mejoran la mezcla | Las restricciones de plástico pueden reducir algunas bolsas |
| La chatarra puede reprocesarse si está limpia | Volatilidad del precio de la resina | Sustitución de importaciones y entrega local rápida | Competidores de bajo costo |
| Maquinaria escalable | Necesita electricidad fiable y operadores cualificados | Contenido reciclado o bolsas más gruesas permitidas | Carga de cumplimiento ambiental |
13. Plan de Marketing y Promoción
El marketing debe centrarse en la incorporación de distribuidores, muestreo en cadenas minoristas, maquetas de bolsas impresas, rápida entrega de tamaños personalizados, fiabilidad de entrega y disciplina crediticia. Los KPIs incluyen pedidos repetidos, rollos rechazados, tasa de desechos, entrega a tiempo, margen por SKU y días de cuentas por cobrar.
14. Plan de Precios
| Producto | Precio de venta de planificación | Lógica de precios |
|---|---|---|
| Bolsas tipo camiseta | USD 1,700–2,000/t | Sensible al precio y dependiente del calibre |
| Bolsas planas | USD 1,800–2,150/t | El tamaño, la claridad y el embalaje importan |
| Bolsas de basura | USD 1,850–2,350/t | La resistencia y la calidad del rollo impulsan el valor |
| Bolsas impresas para minoristas | USD 2,150–2,750/t | Los colores de impresión, la tinta y el MOQ afectan el precio |
| Precio de modelo combinado | USD 1,900/t | Utilizado para el modelo financiero base |
15. Plan de Distribución
La distribución debe combinar ventas directas B2B a grandes compradores con cobertura mayorista para SKUs estándar. Las bolsas impresas requieren aprobación de arte, depósitos y programación de producción. Los nuevos clientes deben recibir límites de crédito estrictos hasta que se demuestre el historial de pagos.
16. Maquinaria, Equipo y Costos de la Línea de Producción

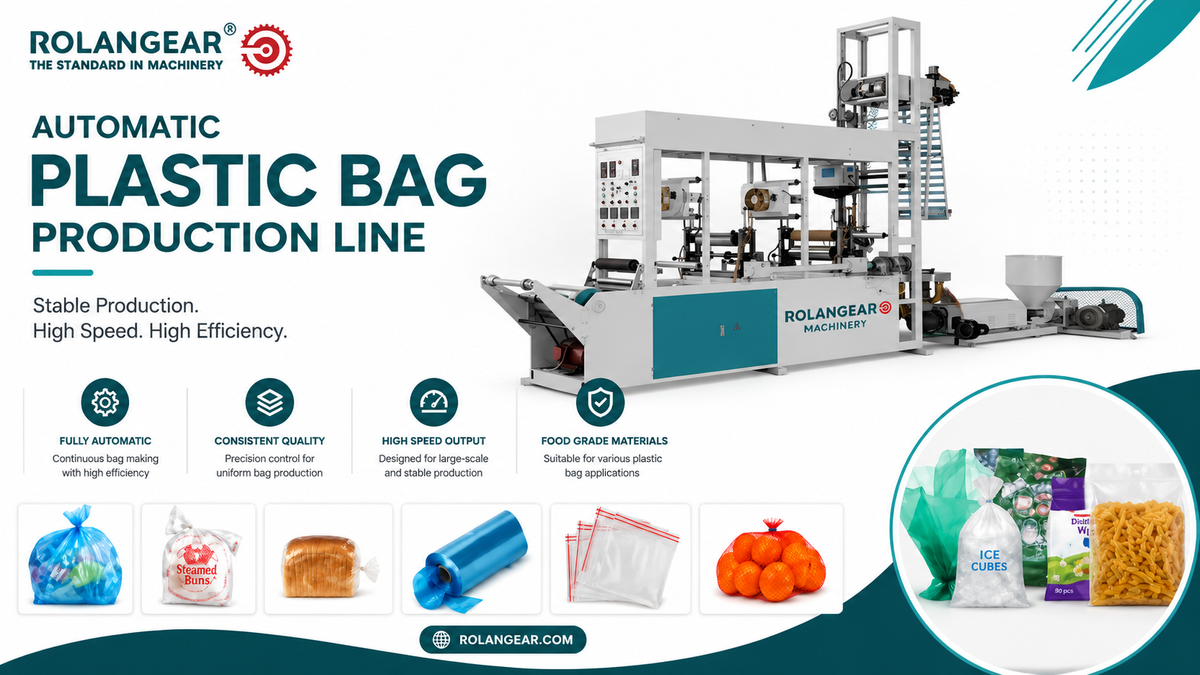
Los costos de la maquinaria son estimaciones presupuestarias de planificación, no cotizaciones de proveedores. Las ofertas finales deben confirmar el ancho de salida, el rango de grosor, el tamaño del troquel, los colores de la impresora, la velocidad de sellado, la carga de energía, las piezas de repuesto y el alcance de la instalación.
| Máquina/equipo | Función | Estimación presupuestaria |
|---|---|---|
| Línea de extrusión de película soplada | Forma rollos de película | USD 140k–260k |
| Máquinas de corte y sellado de bolsas | Convierte rollos en bolsas | USD 80k–180k |
| Unidades de perforación/conteo | Perforación de asas y paquetes | USD 25k–70k |
| Impresora flexográfica, opcional | Producción de bolsas impresas | USD 70k–160k |
| Triturador de chatarra/soporte de reciclaje | Reprocesa chatarra limpia | USD 25k–80k |
| Compresor/enfriador/eléctrico | Servicios de fábrica | USD 40k–90k |
| Herramientas de control de calidad | Comprobaciones de espesor, peso y sellado | USD 8k–25k |
17. Costos de edificios, instalaciones y construcción
La instalación debe incluir almacenamiento de resina, sala de extrusión, almacenamiento de rollos, zona de impresión si está instalada, zona de corte/sellado, almacén de productos terminados, manipulación de residuos, sala de control de calidad, área de mantenimiento, oficina y muelle de carga. El caso base asume un edificio industrial existente con acondicionamiento, no la compra de terrenos.
18. Capacidad de producción e idoneidad de la línea

Producción efectiva = 400 kg/hora × 85 % = 340 kg/hora. Producción diaria = 340 × 20 horas = 6,8 toneladas/día. Producción bruta anual = 6,8 × 300 = 2040 toneladas/año. Producción vendible después de un rendimiento del 95 % = 1938 toneladas/año. Los cuellos de botella pueden ocurrir en cambios de calibre, configuración de impresión, estabilidad de refrigeración, velocidad de sellado y manipulación de rollos.
19. Cotizaciones de proveedores y ofertas técnicas
No se proporcionó ninguna cotización de proveedor. Las ofertas técnicas finales deben confirmar los grados de resina, el ancho máximo de la lámina plana, el rango de espesores, la producción por espesor, el recuento de colores de la impresora, el control servo, el ancho de sellado, el rango de longitud de la bolsa, la carga de energía, la garantía, las piezas de repuesto, la capacitación y el Incoterm.
20. Costos de materias primas
Los principales insumos son HDPE, LDPE, LLDPE, masterbatch, tinta, sistema de tinta a base de disolvente o agua, núcleos, cartones, flejes y etiquetas. El costo variable base es de USD 1350/tonelada de bolsas terminadas, incluyendo resina, aditivos, mano de obra directa, energía, chatarra y embalaje directo. La resina es el principal motor del margen.
21. Requisitos y gastos operativos

Los gastos operativos fijos anuales se estiman en 320 000 USD en el Año 1 antes de la depreciación, aumentando un 3 % anualmente. Esto cubre la gestión, la supervisión, el control de calidad, el mantenimiento, las ventas/administración, los seguros, la seguridad, el marketing básico y los gastos generales.
22. Requisitos de servicios públicos
| Servicio | Requisito a confirmar | Efecto |
|---|---|---|
| Electricidad | Suministro trifásico para calentadores, motores y selladores | Principal impulsor de tiempo de actividad y costo |
| Aire comprimido | Controles de perforación/sellado | Fiabilidad de la conversión |
| Refrigeración/enfriador | Estabilidad de burbujas y películas | Calidad y velocidad |
| Ventilación | Control de calor y olor a tinta | Confort laboral y EHS |
| Seguridad contra incendios | Alarmas, extintores y separación de almacenamiento | Control de riesgo de inventario |
| Gestión de residuos | Segregación y eliminación de chatarra limpia | Cumplimiento y rendimiento |
23. Estructura organizativa y de gestión
| Rol | Número de empleados | Principal responsabilidad |
|---|---|---|
| Gerente general | 1 | Operaciones, ventas y finanzas |
| Supervisores de producción | 2 | Producción por turno, desperdicio y operadores |
| Operadores de extrusoras | 4 | Extrusión de película y control de calibre |
| Operadores de corte/sellado | 6 | Conversión y embalaje de bolsas |
| Operadores de impresión | 2 | Arte y calidad de impresión |
| Técnico de control de calidad | 1 | Comprobaciones de espesor, peso y sellado |
| Mantenimiento/electricista | 2 | Soporte mecánico y eléctrico |
| Almacén/despacho | 3 | Recepción, almacenamiento y carga |
| Ventas/administración/contabilidad | 3 | Pedidos, facturas y servicio al cliente |
24. Costos de inversión
| Artículo de inversión | Estimación | Base |
|---|---|---|
| Línea de extrusión y fabricación de bolsas | $420,000 | Paquete de equipos presupuestario |
| Opción auxiliar de impresión/perforación | $120,000 | Mejora la mezcla de productos |
| Electricidad, compresor, refrigeración y ventilación | $130,000 | Asignación de servicios públicos |
| Acondicionamiento de edificios, estanterías y seguridad contra incendios | $100,000 | Subsidio de edificio existente |
| Control de calidad, taller, manipulación y TI | $90,000 | Equipo de apoyo |
| Flete, instalación y puesta en marcha | $70,000 | Depende del destino |
| Preoperativo, permisos y lanzamiento | $35,000 | Estimación de planificación |
| Reserva de contingencia | $45,000 | Reserva aproximada |
| Capital de trabajo inicial | $120,000 | Resina, inventario y cuentas por cobrar |
| Inversión total del proyecto | $1.10m | Subtotal calculado |
25. Requisitos y condiciones de financiación
La financiación base asume un 40 % de capital propio y un 60 % de deuda. El requisito de capital propio es de 440 000 USD y el requisito de préstamo es de 660 000 USD. Los términos del préstamo se modelan con un interés anual del 9 %, un reembolso de capital igual a cinco años y sin período de gracia.
26. Previsiones de ingresos y ventas
| Año | Utilización | Volumen de ventas, toneladas | Ingresos | Beneficio bruto | EBITDA | Beneficio neto | CSD |
|---|---|---|---|---|---|---|---|
| A1 | 50.0% | 969 | $1.84m | $532,950 | $212,950 | $44,440 | 1.05x |
| A2 | 65.0% | 1,260 | $2.39m | $692,835 | $363,235 | $174,172 | 1.78x |
| A3 | 75.0% | 1,454 | $2.76m | $799,425 | $459,937 | $261,038 | 2.35x |
| A4 | 85.0% | 1,647 | $3.13m | $906,015 | $556,342 | $347,666 | 3.01x |
| A5 | 90.0% | 1,744 | $3.31m | $959,310 | $599,147 | $391,414 | 3.48x |
| Escenario | Supuestos clave | Ventas A5 | Ingresos A5 | Interpretación |
|---|---|---|---|---|
| Conservador | 70% de utilización; precio -6%; resina +5% | 1,357 t/año | $2.43m | Marginal; requiere corrección |
| Caso base | 90% de utilización; precio de 1,900 USD/t | 1,744 t/año | $3.31m | Positivo bajo supuestos |
| Optimista | 95% de utilización; precio +5%; resina estable | 1,841 t/año | $3.67m | Fuerte si se consiguen contratos |
27. Estados financieros
| Año | Utilización | Volumen de ventas | Ingresos | Beneficio bruto | EBITDA | Beneficio neto | DSCR |
|---|---|---|---|---|---|---|---|
| A1 | 50.0% | 969 | $1.84m | $532,950 | $212,950 | $44,440 | 1.05x |
| A2 | 65.0% | 1,260 | $2.39m | $692,835 | $363,235 | $174,172 | 1.78x |
| A3 | 75.0% | 1,454 | $2.76m | $799,425 | $459,937 | $261,038 | 2.35x |
| A4 | 85.0% | 1,647 | $3.13m | $906,015 | $556,342 | $347,666 | 3.01x |
| A5 | 90.0% | 1,744 | $3.31m | $959,310 | $599,147 | $391,414 | 3.48x |
| Año | Flujo de caja operativo | Reembolso de capital de deuda | Flujo de caja apalancado | Flujo de caja acumulado de capital | Deuda final |
|---|---|---|---|---|---|
| A1 | $142,440 | $132,000 | $10,440 | $-429,560 | $528,000 |
| A2 | $272,172 | $132,000 | $140,172 | $-289,388 | $396,000 |
| A3 | $359,038 | $132,000 | $227,038 | $-62,350 | $264,000 |
| A4 | $445,666 | $132,000 | $313,666 | $251,315 | $132,000 |
| A5 | $489,414 | $132,000 | $357,414 | $608,729 | $0 |
| Año | Activos fijos netos | Inventario | Cuentas por cobrar | Efectivo | Activos totales | Cuentas por pagar | Saldo del préstamo | Capital propio + ganancias retenidas | Pasivos + capital propio |
|---|---|---|---|---|---|---|---|---|---|
| A1 | $882,000 | $89,599 | $176,544 | $-64,024 | $1.08m | $71,679 | $528,000 | $484,440 | $1.08m |
| A2 | $784,000 | $116,479 | $229,507 | $17,809 | $1.15m | $93,183 | $396,000 | $658,612 | $1.15m |
| A3 | $686,000 | $134,399 | $264,816 | $205,954 | $1.29m | $107,519 | $264,000 | $919,650 | $1.29m |
| A4 | $588,000 | $152,319 | $300,125 | $480,727 | $1.52m | $121,855 | $132,000 | $1.27m | $1.52m |
| A5 | $490,000 | $161,279 | $317,779 | $818,695 | $1.79m | $129,023 | $0 | $1.66m | $1.79m |
28. Indicadores financieros y análisis financiero
| Indicador | Fórmula / base | Resultado base | Interpretación |
|---|---|---|---|
| Margen bruto | Ingresos menos costo de bienes vendidos dividido por ingresos | 28.9% | Aceptable si la resina está controlada |
| Margen de contribución | Precio de venta menos costo variable | USD 550/tonelada | Utilizado para el punto de equilibrio |
| Cantidad de equilibrio | Costo fijo + depreciación dividido por contribución | 760 toneladas/año | Requiere 39.2% de utilización |
| ROI | Beneficio neto promedio dividido por inversión | 22.2% | Positivo después del arranque |
| VAN | Flujo de caja no apalancado descontado al 12% | $171,145 | Positivo pero sensible |
| TIR | Tasa de descuento donde el VAN es cero | 17.2% | Por encima de la tasa de corte del 12% |
| Período de recuperación | Recuperación acumulada del flujo de caja de capital apalancado | Durante el año 4 | Depende de las cuentas por cobrar |
| Deuda/capital propio | Deuda dividida por capital propio | 1.50x | Apalancamiento moderado |
| Requisito mínimo de efectivo | Capital de trabajo inicial | $120,000 | Prueba de estrés para compras de resina |
29. Análisis del punto de equilibrio
Contribución por tonelada = 1,900 − 1,350 = 550 USD/tonelada. Cantidad de equilibrio = costo fijo más depreciación ($418,000) ÷ contribución = 760 toneladas/año. Ingresos de equilibrio = $1.44m y utilización de equilibrio = 39.2%.
Fuente: modelo de caso base calculado, 2026. Unidad: porcentaje de la capacidad anual vendible.
30. Análisis de sensibilidad
| Variable analizada | Impacto en el VAN | Criticidad |
|---|---|---|
| Precio de venta -10% | $-420,000 | Alto |
| Costo de resina +10% | $-285,000 | Alto |
| Utilización de ventas -10% | $-222,000 | Alto |
| Retraso en el lanzamiento 6 meses | $-190,000 | Alto |
| Costo de capital +10% | $-110,000 | Medio |
| Mano de obra +10% | $-51,000 | Medio |
| Electricidad +10% | $-38,000 | Medio |
| Intereses +2 pts | $-26,000 | Medio |
| Precio de venta +10% | $420,000 | Alto |
Fuente: modelo de sensibilidad calculado, 2026. Unidad: Impacto en USD en el VAN.
Clasificación de variables críticas: el precio de venta, el costo de la resina, la utilización y el retraso en el lanzamiento son los impulsores de viabilidad más fuertes.
31. Requisitos Legales y Regulatorios
Los requisitos normalmente incluyen registro de la empresa, licencia industrial, aprobación ambiental, aprobación de seguridad contra incendios, normas de seguridad para trabajadores, registro fiscal, procedimientos de gestión de residuos y obligaciones de etiquetado de productos. Muchos países restringen las bolsas de plástico de un solo uso por grosor, contenido reciclado, tarifas o prohibiciones. Las normas de envasado de la UE muestran la dirección de una regulación más estricta de los residuos de envases, pero la legislación nacional controla las obligaciones reales [6].
32. Análisis de Medio Ambiente, Salud y Seguridad

Los problemas de EHS incluyen superficies calientes de extrusoras, puntos de pellizco, cortadores, barras de sellado, levantamiento de sacos de resina, carga de fuego por inventario de plástico, manipulación de tinta o solventes, humos, ruido y gestión de chatarra. La guía de OSHA para la industria del plástico destaca la protección de maquinaria, ergonomía, ventilación y prácticas de bloqueo [7].
33. Análisis de Riesgos y Registro de Riesgos
| Riesgo | Probabilidad | Impacto | Mitigación |
|---|---|---|---|
| Aumento del precio de la resina | Alto | Alto | Contratos de suministro y cláusulas de ajuste de precios |
| Restricciones de plástico | Medio | Alto | Cambio a calibres, revestimientos y formatos reutilizables permitidos |
| Presión de precios de la competencia | Alto | Medio-alto | Diferenciación por calidad, entrega y servicio |
| Interrupción del suministro eléctrico | Medio | Alto | Confirmar opciones de suministro y respaldo |
| Alta tasa de chatarra | Medio | Medio-alto | Capacitación y controles de proceso |
| Retrasos en las cuentas por cobrar | Medio | Medio | Límites de crédito y depósitos |
| Incidente de incendio/EHS | Bajo-medio | Alto | Seguridad contra incendios y limpieza |
34. Calendario de Implementación
| Fase | Duración | Tareas clave |
|---|---|---|
| Localización de la viabilidad | 2–4 semanas | Datos del país, precios de resina, regulaciones y entrevistas con clientes |
| Ingeniería, permisos y cotizaciones | 1–2 meses | Diseño, carga de energía, permisos y ofertas de proveedores |
| Adquisición y fabricación | 2–3 meses | Pedido de máquinas, herramientas y envío |
| Obras civiles y servicios públicos | 2–3 meses | Instalación eléctrica, compresor, refrigeración, ventilación y almacén |
| Instalación y puesta en marcha | 4–6 semanas | Instalación de máquinas, pruebas de películas y capacitación |
| Lanzamiento comercial | 1 mes | Muestreo, primeros pedidos y control de cuentas por cobrar |
Fuente: supuesto de planificación de la implementación, 2026. Unidad: meses.
Gráficos Basados en Datos
Fuente: modelo de caso base calculado, 2026. Unidad: millones de USD.
Fuente: modelo de caso base calculado, 2026. Unidad: miles de USD.
Fuente: supuesto de aumento progresivo, 2026. Unidad: porcentaje.
Fuente: modelo de inversión, 2026. Unidad: USD.
Fuente: supuesto de estructura de costos, 2026. Unidad: participación en el costo variable.
Fuente: calendario de deuda, 2026. Unidad: miles de USD.
35. Fuentes y Supuestos
Registro de Supuestos
| Supuesto | Valor | Base | Confianza | Efecto |
|---|---|---|---|---|
| Moneda | USD | Supuesto del analista | Medio | Todas las salidas |
| Capacidad | 400 kg/h × 85% × 20 h/día × 300 días × 95% | Supuesto calculado | Medio | Ingresos |
| Producción vendible | 1,938 t/año | Calculado | Medio | Previsión |
| Precio de venta | USD 1,900/t | Supuesto de planificación | Bajo-medio | Ingresos y margen |
| Costo variable | USD 1,350/t | Resina, aditivos, mano de obra, energía y embalaje | Medio | Margen bruto |
| Inversión total | $1.10m | Presupuesto de maquinaria y asignación de fábrica | Medio | VAN y financiación |
| Financiación | 40% capital, 60% deuda, 9%, cinco años | Supuesto del analista | Bajo-medio | Flujo de caja |
| Impuestos y descuento | 20% impuestos, 12% descuento | Supuesto de planificación | Bajo-medio | VAN y beneficio neto |
Registro de Fuentes
| Ref | Organización | Fuente y URL | Datos utilizados | Fecha de acceso | Confianza |
|---|---|---|---|---|---|
| [1] | Banco Mundial | Indicadores de Desarrollo Mundial: Manufactura, valor agregado, https://api.worldbank.org/v2/indicator/NV.IND.MANF.CD | Fuente de selección macro/manufactura | 6 de agosto de 2026 | Alta |
| [2] | Banco Mundial | Indicadores de Desarrollo Mundial: Población total, https://api.worldbank.org/v2/indicator/SP.POP.TOTL | Contexto de localización de la demanda | 6 de agosto de 2026 | Alta |
| [3] | USITC / HTS | Capítulo 39 Plásticos y artículos, https://hts.usitc.gov/reststop/file?release=currentRelease&filename=Chapter%2039 | Advertencia sobre la clasificación HS 3923 | 6 de agosto de 2026 | Alta para referencia HS |
| [4] | PNUMA | Contaminación por plásticos, https://www.unep.org/plastic-pollution | Contexto de la política ambiental | 6 de agosto de 2026 | Medio-alto |
| [5] | OCDE | Recursos de políticas sobre plásticos, https://www.oecd.org/environment/plastics/ | Contexto global de plásticos | 6 de agosto de 2026 | Medio-alto |
| [6] | Comisión Europea | Residuos de envases, https://environment.ec.europa.eu/topics/waste-and-recycling/packaging-waste_en | Contexto regulatorio de residuos de envases | 6 de agosto de 2026 | Alta para contexto de la UE |
| [7] | OSHA | Industria del plástico - Peligros y soluciones, https://www.osha.gov/plastic-industry/hazards-solutions | Contexto de peligros de seguridad | 6 de agosto de 2026 | Alta |
36. Sección de Consulta
¿Necesita un estudio localizado de una fábrica de bolsas de plástico?
Para un informe bancable de una fábrica de bolsas de plástico, confirme el país, la ciudad, el grosor de bolsa permitido, la mezcla de productos objetivo, el precio de la resina, la tarifa de servicios públicos, el estado del edificio, los contratos con clientes, los requisitos de impresión, el plan de reciclaje, la tasa de impuestos, los términos de financiación y las cotizaciones de proveedores. Rolangear puede apoyar la configuración de la línea de producción, la selección de maquinaria, la planificación de capacidad y la comparación de cotizaciones.
Contactar a Rolangear37. Conclusión Final y Recomendación
La fábrica de bolsas de plástico es técnicamente factible y financieramente positiva bajo los supuestos de planificación establecidos. El modelo es más atractivo cuando la planta asegura un suministro confiable de resina, se enfoca en categorías de bolsas permitidas, mantiene bajos los desechos, firma compromisos con distribuidores o minoristas y controla los días de cuentas por cobrar. La recomendación es proceder a una validación localizada antes de la inversión final: confirmar las regulaciones de bolsas de plástico, los precios de venta locales, los costos de resina y masterbatch, la confiabilidad de la electricidad, la idoneidad del edificio, los requisitos de permisos ambientales y las cotizaciones formales de los proveedores.