Estudio de viabilidad de una fábrica de yogur y leche
Estudio de viabilidad para una fábrica de yogur y leche
Estudio de planificación profesional para una fábrica de productos lácteos de pequeña a mediana escala que produce leche pasteurizada, yogur batido, yogur bebible y envases de productos lácteos seleccionados para servicios de alimentos. Dado que no se suministró ningún país, ciudad, cotización de proveedor o mezcla exacta de productos, este es un estudio de viabilidad preliminar al estilo Rolangear que utiliza referencias transparentes de supuestos en USD que deben localizarse antes de la aprobación de la inversión.
1. Resumen ejecutivo
El proyecto propuesto es una fábrica de procesamiento de lácteos diseñada con una capacidad de procesamiento nominal de 10.000 litros/día de equivalente de leche. El caso base asume 300 días de operación/año, un rendimiento vendible del 95% y una producción vendible anual de 2.850.000 litros equivalentes. La mezcla de productos está planificada como leche pasteurizada, yogur y yogur bebible, con ventas a través de supermercados, distribuidores de comestibles, HORECA, escuelas y cuentas seleccionadas de marca propia.

Utilizando un precio de venta estándar mezclado en fábrica de 0,86 USD/L equivalente, un costo variable de 0,48 USD/L equivalente, una inversión total de 850.000 $ y un aumento de la utilización del 50% al 90%, los ingresos del año 5 alcanzan los 2,21 millones de $ y el beneficio neto del año 5 alcanza los 480.416 $. El modelo base produce un VAN de 540.442 $ con una tasa de descuento del 12% y una TIR del 31,4%. La utilización de equilibrio es del 33,7%. El proyecto es técnicamente factible y financieramente positivo bajo los supuestos establecidos, pero la aprobación final debe depender del suministro local de leche cruda, la capacidad de la cadena de frío, la fijación de precios de los productos, los permisos, el estado del edificio de la fábrica y las cotizaciones de maquinaria confirmadas.
2. Alcance y metodología del estudio
Este estudio de viabilidad abarca el concepto del proyecto, el análisis del producto, los indicadores económicos y la ubicación del proyecto, los indicadores del mercado objetivo, la demanda, la producción local, las advertencias de importación y exportación, los competidores, la brecha de mercado, el DAFO, el marketing, los precios, la distribución, la maquinaria, la capacidad de producción, las necesidades de cotización de los proveedores, las materias primas, los requisitos operativos, los servicios públicos, el personal, la inversión, la financiación, los estados financieros, los indicadores financieros, el punto de equilibrio, la sensibilidad, los requisitos legales/regulatorios, EHS, el riesgo, el calendario de implementación, las fuentes, los supuestos, la consulta y la recomendación final.
La metodología combina un contexto agrícola y de estándares respaldado por fuentes, fórmulas de capacidad transparentes, supuestos prácticos de costos de maquinaria, un modelo financiero a cinco años y pruebas de sensibilidad. Se utilizan fuentes de la FAO y el Codex para datos lácteos y contexto de estándares, mientras que los costos de maquinaria e inversión se tratan como estimaciones de planificación presupuestaria en lugar de cotizaciones finales de proveedores [1][2][5][6].
3. Concepto y naturaleza del proyecto
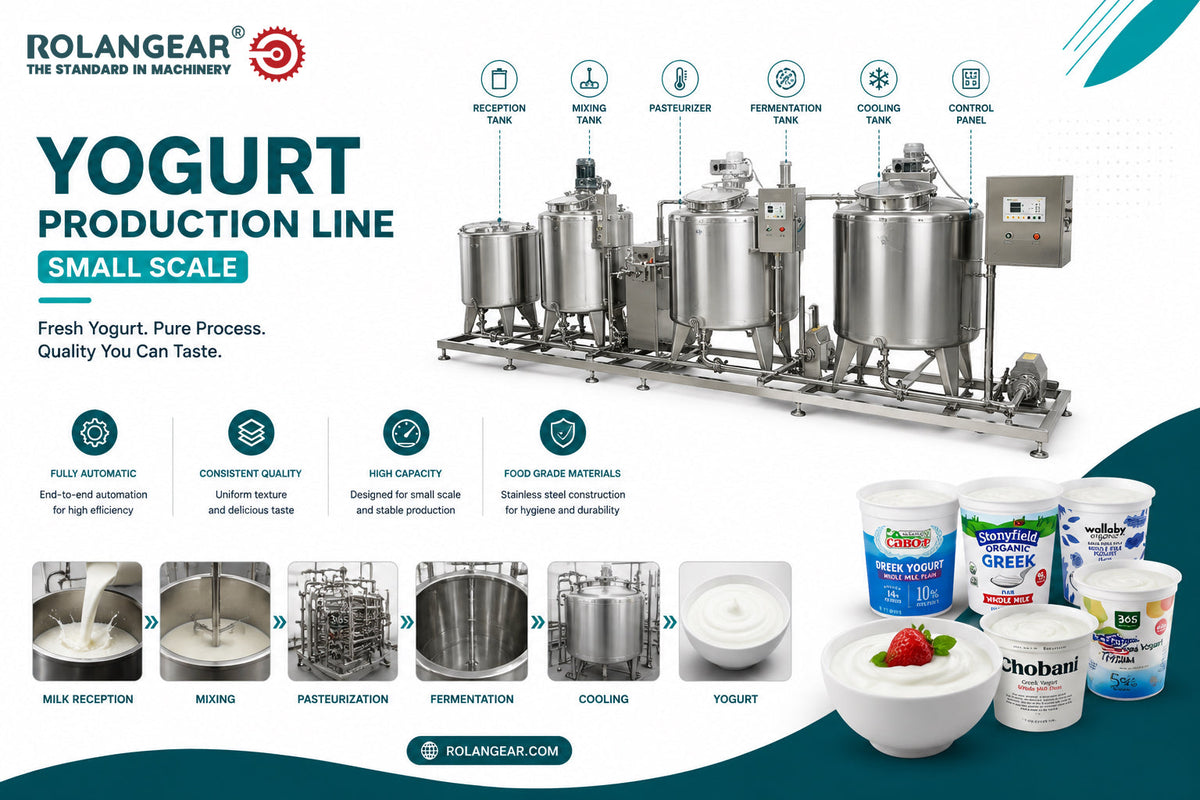
La naturaleza del proyecto es una planta industrial de procesamiento de alimentos y productos lácteos. La leche cruda se recibe, filtra, enfría, estandariza, pasteuriza, homogeneiza cuando es necesario, fermenta para productos de yogur, envasa, sella, codifica, almacena en frío y distribuye a través de canales refrigerados. El modelo de negocio puede combinar la producción local de lácteos, la sustitución de importaciones de productos lácteos de larga duración, el suministro minorista fresco, los contratos HORECA y la producción de lácteos de marca propia.
Los factores de éxito incluyen una calidad estable de la leche cruda, una higiene estricta, la fiabilidad de la cadena de frío, un envasado atractivo, una mezcla correcta de productos, un sabor consistente, el control de la vida útil, la cobertura del distribuidor y los registros disciplinados de control de calidad.

4. Análisis del producto y tabla de especificaciones del producto
Los productos principales son la leche pasteurizada y el yogur. Las normas de los productos y las reglas de etiquetado deben verificarse localmente; el Codex proporciona un contexto de estándares internacionales para los términos lácteos y los productos relacionados con la leche, pero este estudio no afirma una certificación verificada [2]. Las extensiones futuras pueden incluir yogur de frutas, yogur estilo griego, laban, bebidas tipo kéfir, nata, mantequilla o queso, dependiendo de la demanda del mercado y la configuración del equipo.
| Producto | Envase típico | Canal objetivo | Notas de calidad / almacenamiento |
|---|---|---|---|
| Leche pasteurizada | Botella o bolsa de 200 ml / 500 ml / 1 L | Comercio minorista, escuelas, HORECA | Requiere cadena de frío, vida útil corta, control de higiene |
| Yogur batido o cuajado | Vaso de 100 g / 125 g / 200 g | Supermercados, tiendas de comestibles, tiendas de conveniencia | Control de fermentación, cultivos, opción de fruta/sabor |
| Yogur bebible / leche con sabor | Botella de 180 ml / 250 ml | Canales minoristas y juveniles | Mayor valor de marca; deben verificarse las normas de azúcar/sabor |
| Envases a granel para servicios de alimentos | Bolsa en caja o cubo de 5 L / 10 L | Panaderías, cafeterías, restaurantes | Precios contractuales y estricto calendario de entregas |
5. Indicadores económicos y ubicación del proyecto
La selección de la ubicación debe priorizar la zona de captación de leche cruda, las rutas de distribución refrigerada, la fiabilidad del suministro eléctrico, el suministro de agua, el tratamiento de aguas residuales, la mano de obra cualificada y el acceso regulatorio. Los conjuntos de datos del Banco Mundial pueden respaldar la evaluación del PIB, la población, la inflación y la logística específicos de cada país una vez que se seleccione el país objetivo [4].
| Factor de ubicación | Peso | Condición preferida | Efecto de viabilidad |
|---|---|---|---|
| Zona de captación de leche cruda | 25% | Cerca de granjas lecheras o centros de recogida de leche refrigerada | Mayor impacto en el coste y la calidad de los insumos |
| Logística de cadena de frío | 20% | Cerca del comercio minorista urbano y la distribución refrigerada | Protege la vida útil y el acceso al mercado |
| Servicios públicos | 15% | Energía fiable, vapor/agua caliente, agua fría y sistema de aguas residuales | Afecta a la pasteurización y la limpieza |
| Edificio de grado alimentario | 15% | Drenaje, suelos lavables, zonificación, cámaras frigoríficas | Reduce el riesgo de incumplimiento y contaminación |
| Habilidades laborales y de control de calidad | 10% | Operadores, tecnólogo lácteo, personal de laboratorio disponible | Apoya la producción consistente |
| Entorno regulatorio | 10% | Requisitos claros de lácteos, seguridad alimentaria y etiquetado | Reduce el retraso en el lanzamiento |
| Suministro de envases | 5% | Proveedores cercanos de vasos/botellas/películas | Reduce el stock y el tiempo de entrega |
6. Indicadores del mercado objetivo
El mercado objetivo incluye hogares, supermercados, mayoristas de comestibles, hoteles, restaurantes, cafeterías, panaderías, escuelas, fábricas, hospitales y compradores institucionales. El consumo de productos lácteos está influenciado por los ingresos, el crecimiento de la población, la confianza en la seguridad alimentaria, la disponibilidad de la cadena de frío y las preferencias de sabor locales.

Las plataformas de datos de la FAO proporcionan conjuntos de datos agrícolas y lácteos, pero la demanda local debe calcularse por país y categoría de producto [1].
| Capa de mercado | Definición | Tratamiento de planificación |
|---|---|---|
| TAM | Todo el consumo de leche, yogur y bebidas lácteas en el país/región | No totalmente disponible para el proyecto |
| SAM | Clientes alcanzables a través de la cadena de frío y la distribución minorista planificadas | Estimado después de la selección de la ubicación |
| Mercado realmente obtenible | Volumen que una nueva marca puede captar en cinco años | Limitado por la confianza, el espacio en estanterías y la densidad de la ruta |
| Previsión de ventas del proyecto | Aumento de la utilización del 50% al 90% | Limitado por la capacidad de la planta |
7. Análisis de la demanda
La demanda debe estimarse mediante la población × el consumo de lácteos per cápita, el análisis de estanterías minoristas, los compromisos de compra de los distribuidores y los contratos de suministro institucional. En este modelo preliminar, las ventas están impulsadas por la capacidad porque no se proporcionaron datos de demanda del país. Fórmula: capacidad vendible anual = 10.000 L/día × 300 días/año × 95% de rendimiento vendible = 2.850.000 L equivalentes/año. Ventas del año 1 = capacidad vendible × 50% de aumento = 1.425.000 L equivalentes.
La confianza es media para la capacidad técnica y baja a media para la absorción del mercado hasta que se verifiquen los datos minoristas locales, de distribuidores y de leche cruda.
8. Análisis de la producción local
El análisis de la producción local debe identificar las lecherías existentes, las plantas de leche pasteurizada, las marcas de yogur, los vendedores de leche informal, los reempacadores de leche en polvo y los proveedores de marcas propias. El volumen de producción exacto no se puede determinar sin datos del país objetivo. Por lo tanto, el estudio trata la producción local como un elemento de diligencia debida requerido en lugar de inventar cifras de suministro.
9. Análisis de importación y exportación con advertencias del código SA
Los códigos SA probables incluyen el SA 0401 para la leche y la nata no concentradas ni azucaradas, el SA 0403 para el yogur, la leche agria y la leche fermentada, y el SA 0402 para los productos lácteos concentrados o azucarados. Estos códigos pueden ser amplios y pueden incluir productos diferentes a la mezcla planificada de leche fresca y yogur. Se deben usar UN Comtrade e ITC Trade Map para el análisis comercial del país objetivo una vez que se confirmen el código SA y el país; los datos SA amplios no deben presentarse como la demanda exacta del proyecto.
10. Análisis de la competencia
| Tipo de competidor | Ejemplos para investigar localmente | Presión competitiva | Respuesta |
|---|---|---|---|
| Grandes marcas lácteas | Procesadores nacionales de leche y yogur | Alta | Competir con frescura, distribución y abastecimiento local |
| Lecherías regionales | Marcas locales de leche pasteurizada y yogur | Media a alta | Usar densidad de ruta y calidad consistente |
| UHT importado / lácteos premium | Leche en polvo importada, leche UHT, yogur premium | Media | Posicionar producto local fresco y packs de valor |
| Sustitutos | Bebidas vegetales, leche en polvo, zumos, refrescos | Media | Diferenciar en nutrición, frescura y calidad de confianza |
| Nuevos entrantes | Pequeños procesadores lácteos y productores de marca blanca | Media | Asegurar contratos de leche cruda y cuentas minoristas temprano |
11. Análisis de la brecha de mercado
La brecha de mercado debe calcularse como la demanda estimada menos la producción local confiable, ajustada por importaciones y exportaciones. Debido a que faltan datos del país, la brecha preliminar no se cuantifica. El proyecto solo necesita vender 2,57 millones de L equivalentes para el año 5, por lo que los compromisos de los distribuidores y el acceso a los estantes minoristas son más importantes que la demanda nacional total.

12. Análisis DAFO
| Fortalezas | Debilidades | Oportunidades | Amenazas |
|---|---|---|---|
| Categoría de alimentos esenciales con consumo diario | Complejidad de la cadena de frío y la seguridad alimentaria | Marca propia, escuelas, hoteles y cadenas minoristas | Volatilidad del precio de la leche cruda |
| Puede combinar leche, yogur y yogur bebible | La vida útil corta aumenta el riesgo de devoluciones | Demanda de productos lácteos frescos locales | Marcas incumbentes fuertes |
| Línea de procesamiento escalable y SKU flexibles | Requiere control de calidad y disciplina de saneamiento calificados | El yogur de valor agregado mejora el margen | Cortes de energía y fallas en la cadena de frío |
13. Plan de marketing y promoción
El plan de marketing debe centrarse en la frescura, el abastecimiento de leche local, el sabor consistente, la higiene visible, el muestreo minorista, las cuentas escolares y HORECA, la fiabilidad de la entrega refrigerada y los contratos de marca propia. Los KPI incluyen puntos de venta activos, tasa de devoluciones, cumplimiento de la temperatura de entrega, pedidos repetidos, margen bruto por SKU, quejas y rendimiento de la vida útil del producto.
14. Plan de precios
| SKU | Precio de planificación estándar ex-fábrica | Lógica de precios |
|---|---|---|
| Leche pasteurizada 1 L | 0.70–0.85 USD/L | Producto minorista de volumen; el margen depende del precio de la leche cruda |
| Vaso de yogur 100–200 g | 0.18–0.35 USD/vaso | Margen de valor añadido superior; el envasado y los cultivos son importantes |
| Yogur bebible 180–250 ml | 0.25–0.45 USD/botella | Canal juvenil y de conveniencia |
| Envase a granel para servicios de alimentos | Basado en contrato | Depende del volumen, la ruta de entrega y las condiciones de pago |
| Precio del modelo combinado | 0.86 USD/L equivalente | Utilizado para el modelo financiero base |
15. Plan de distribución
La distribución debe combinar la entrega directa refrigerada a cuentas clave, mayoristas con almacenamiento en frío, entregas a supermercados, rutas HORECA, escuelas y contratos institucionales. La distribución de productos lácteos requiere monitoreo de temperatura, planificación de rutas, control de cajas y una gestión estricta de devoluciones porque la vida útil es más corta que muchos alimentos envasados.

16. Costos de maquinaria, equipos y líneas de producción
Las páginas del alcance de la maquinaria muestran referencias de líneas de procesamiento de productos lácteos y líneas de producción de yogur, que van desde pequeñas máquinas modulares hasta líneas de procesamiento más grandes; estas son referencias de presupuesto y no cotizaciones de proveedores [5][6].
| Máquina/equipo | Función | Referencia de costo estándar del proveedor de China |
|---|---|---|
| Recepción de leche, filtración, enfriamiento y tanques de almacenamiento | Recibir y almacenar leche cruda | USD 45k–90k |
| Pasteurizador/homogeneizador/separador según sea necesario | Tratamiento térmico y estandarización del producto | USD 80k–180k |
| Tanques de fermentación de yogur y sistema de mezcla | Dosificación de cultivos, fermentación y mezcla | USD 50k–120k |
| Máquinas de llenado y sellado para botellas/vasos/bolsas | Envasado primario | USD 60k–160k |
| Sistema de limpieza CIP | Limpieza automatizada de tanques y tuberías | USD 25k–70k |
| Cuarto frío, enfriador, caldera/sistema de agua caliente, compresor | Servicios públicos y control de temperatura | USD 90k–180k |
| Equipo de laboratorio, transportadores, codificación, embalaje secundario | Control de calidad y soporte de envasado | USD 35k–80k |
17. Costos de construcción e instalaciones
La fábrica debe incluir recepción de leche, sala de procesamiento, sala de fermentación, sala de llenado, almacenamiento de material de embalaje, cuarto frío de productos terminados, laboratorio de control de calidad, sala de CIP/químicos, sala de mantenimiento, área de higiene del personal, oficina, área de carga y manejo de aguas residuales. Los pisos y las paredes deben ser lavables, el drenaje debe ser de grado alimenticio y la zonificación del proceso debe separar el flujo de productos crudos y terminados.
18. Capacidad de producción e idoneidad de la línea

La capacidad nominal es de 10.000 L/día equivalente de leche. Producción anual vendible = 10.000 × 300 × 95% = 2.850.000 L equivalentes. Pueden producirse cuellos de botella en la pasteurización, el tiempo de retención del tanque de fermentación, la velocidad de llenado de vasos/botellas, la capacidad del cuarto frío, el tiempo de respuesta del CIP, la recepción de leche cruda y la distribución refrigerada.
19. Cotizaciones y ofertas técnicas de proveedores
No se proporcionó ninguna cotización de proveedor. Las ofertas finales deben confirmar la calidad de la leche cruda, la mezcla de productos, la capacidad de pasteurización, el tamaño del homogeneizador, el volumen de fermentación del yogur, el formato de llenado, el tipo de embalaje, la automatización CIP, los servicios públicos, Incoterm, las piezas de repuesto, la instalación, la capacitación y la garantía.
20. Costos de materias primas
Las principales materias primas son leche cruda, cultivos iniciadores, azúcar, estabilizador (cuando se permite), preparados/sabores de frutas, botellas/vasos/tapas/film, cartones, productos químicos de limpieza y consumibles de laboratorio. El costo variable base es de USD 0,48/L equivalente, incluyendo leche cruda, embalaje, cultivos, servicios públicos y pérdida de producción normal. El precio de la leche cruda es el elemento de costo más importante y debe confirmarse localmente.
21. Requisitos y gastos operativos
Los gastos operativos fijos anuales más el mantenimiento se estiman en $300.000. Esto incluye gerencia, supervisión de producción, control de calidad, mantenimiento, personal de ventas/administración, soporte de marketing, mantenimiento, seguros, administración general y gastos generales de distribución básicos, excluyendo los costos de ventas variables.
22. Requisitos de servicios públicos
| Utilidad | Requisito típico a confirmar | Efecto de viabilidad |
|---|---|---|
| Electricidad | Energía trifásica, generador de respaldo para refrigeración | Protege la cadena de frío y el tiempo de actividad |
| Vapor/agua caliente | Calentamiento para pasteurización y CIP | Crítico para el procesamiento de lácteos |
| Agua fría/refrigeración | Enfriamiento de leche, almacenamiento de yogur, cuartos fríos | Protege la calidad del producto |
| Agua | Agua de proceso, limpieza y alimentación de calderas | Afecta la higiene y el CIP |
| Aire comprimido | Llenado, válvulas y máquinas de envasado | Afecta la estabilidad de la línea |
| Aguas residuales | Efluente lácteo con alta carga orgánica | Riesgo de cumplimiento ambiental |
23. Estructura organizacional y de gestión
| Función | Número de empleados | Responsabilidad principal |
|---|---|---|
| Gerente general | 1 | Operaciones, ventas y finanzas |
| Tecnólogo lácteo/gerente de producción | 1 | Recetas, control de procesos y rendimiento |
| Supervisores de turno | 2 | Ejecución de la producción |
| Operadores y empacadores | 14 | Procesamiento, llenado, empaque e higiene |
| Personal de calidad/laboratorio | 3 | Análisis de leche cruda, microbiología, registros de liberación |
| Mantenimiento y servicios públicos | 3 | Mantenimiento de caldera/enfriador/CIP/máquinas |
| Almacén frigorífico/logística | 5 | Inventario y entrega refrigerada |
| Ventas/administración/finanzas | 5 | Pedidos, cuentas y servicio al cliente |
24. Costos de inversión
| Artículo de inversión | Estimación estándar | Base |
|---|---|---|
| Adecuación del edificio, drenaje higiénico y cámaras frigoríficas | $180,000 | Asignación estándar de equipamiento industrial; excluye la compra de terrenos |
| Procesamiento de lácteos, pasteurización, fermentación de yogur y línea de llenado | $360,000 | Paquete de costo estándar del proveedor de China |
| Servicios: caldera/agua caliente, enfriadora, compresor, transformador, tanques | $120,000 | Asignación de servicios auxiliares |
| Laboratorio, equipo de control de calidad, mobiliario e TI | $35,000 | Configuración básica de control de calidad de grado alimenticio |
| Presupuesto de instalación, flete, aranceles y puesta en marcha | $70,000 | Depende del destino e Incoterm |
| Vehículos, cajas y manejo de cadena de frío | $35,000 | Soporte básico de distribución refrigerada |
| Gastos preoperativos, permisos, capacitación y lanzamiento | $25,000 | Estimación de planificación |
| Reserva de contingencia | $55,000 | Reserva aproximada |
| Capital de trabajo inicial | $70,000 | Leche cruda, embalaje, cultivos, repuestos y cuentas por cobrar |
| Inversión total del proyecto | $0.85m | Subtotal calculado |
25. Requisitos y condiciones de financiación
La financiación base asume un 40% de capital propio y un 60% de deuda. El requisito de capital propio es de $340.000 y el de préstamo es de $510.000. Los términos del préstamo se modelan con un interés anual del 9%, un reembolso de capital a cinco años en cuotas iguales y sin período de gracia. La financiación real depende del país, la garantía, los términos bancarios y la solidez crediticia del patrocinador.

26. Previsiones de ingresos y ventas
| Año | Utilización | Volumen de ventas, L eq. | Ingresos | Beneficio neto | DSCR |
|---|---|---|---|---|---|
| A1 | 50.0% | 1,425,000 | $1.23m | $104,480 | 1.15x |
| A2 | 65.0% | 1,852,500 | $1.59m | $241,784 | 2.21x |
| A3 | 75.0% | 2,137,500 | $1.84m | $335,768 | 3.09x |
| A4 | 85.0% | 2,422,500 | $2.08m | $429,752 | 4.11x |
| A5 | 90.0% | 2,565,000 | $2.21m | $480,416 | 4.91x |
El escenario optimista asume una incorporación más rápida de distribuidores y una utilización del 95% en el año 5. El escenario conservador asume una inclusión minorista más lenta, una utilización del 75% en el año 5, un precio de venta un 5% más bajo y un mayor costo de leche cruda/empaque.
27. Estados financieros
| USD | A1 | A2 | A3 | A4 | A5 |
|---|---|---|---|---|---|
| Ingresos | $1.23m | $1.59m | $1.84m | $2.08m | $2.21m |
| Costo de ventas | $684,000 | $889,200 | $1.03m | $1.16m | $1.23m |
| Margen bruto | $541,500 | $703,950 | $812,250 | $920,550 | $974,700 |
| EBITDA | $241,500 | $403,950 | $512,250 | $620,550 | $674,700 |
| Depreciación | $65,000 | $65,000 | $65,000 | $65,000 | $65,000 |
| EBIT | $176,500 | $338,950 | $447,250 | $555,550 | $609,700 |
| Intereses | $45,900 | $36,720 | $27,540 | $18,360 | $9,180 |
| Impuestos | $26,120 | $60,446 | $83,942 | $107,438 | $120,104 |
| Beneficio neto | $104,480 | $241,784 | $335,768 | $429,752 | $480,416 |
| USD | A0 | A1 | A2 | A3 | A4 | A5 |
|---|---|---|---|---|---|---|
| Capital/flujo de caja del proyecto | -$340,000 | $67,480 | $204,784 | $298,768 | $392,752 | $443,416 |
| Flujo de caja acumulado | -$340,000 | -$272,520 | -$67,736 | $231,032 | $623,784 | $1.07m |
| Amortización del principal de la deuda | - | $102,000 | $102,000 | $102,000 | $102,000 | $102,000 |
| Deuda de cierre | - | $408,000 | $306,000 | $204,000 | $102,000 | $0 |
| USD | A1 | A2 | A3 | A4 | A5 |
|---|---|---|---|---|---|
| Activos fijos netos | $535,000 | $470,000 | $405,000 | $340,000 | $275,000 |
| Capital de trabajo y efectivo | $70,000 | $70,000 | $301,032 | $693,784 | $1.14m |
| Total de activos | $605,000 | $540,000 | $706,032 | $1.03m | $1.41m |
| Deuda | $408,000 | $306,000 | $204,000 | $102,000 | $0 |
| Capital y ganancias retenidas | $197,000 | $234,000 | $502,032 | $931,784 | $1.41m |
| Pasivos más capital | $605,000 | $540,000 | $706,032 | $1.03m | $1.41m |
28. Indicadores y análisis financieros
| Indicador | Fórmula/base | Resultado base | Interpretación |
|---|---|---|---|
| Margen bruto | (Ingresos - Costo de ventas) / Ingresos | 44.2% | Saludable si la leche cruda y el embalaje están controlados |
| Margen de contribución | Precio - costo variable | USD 0.38/L eq. | Utilizado para el punto de equilibrio |
| Cantidad de equilibrio | Costo fijo / contribución | 960,526 L eq./año | Requiere una utilización del 33.7% |
| Retorno de la inversión | Beneficio neto promedio / inversión | 37.5% | Positivo después del arranque bajo supuestos de costo estándar |
| VAN | Flujo de caja libre para el capital descontado al 12% | $540,442 | Positivo en el caso base |
| TIR | Tasa de descuento donde VAN = 0 | 31.4% | Superior a la tasa de descuento, sujeto a validación local |
| Período de recuperación | Recuperación de efectivo apalancado acumulado | Durante el año 4 | Depende de la distribución estable y el control de la cadena de frío |
| Deuda a capital | Deuda / capital | 1,50x | Apalancamiento moderado |
| DSCR | Flujo de caja operativo / servicio de la deuda | A1 1,15x; A5 4,91x | Débil en el año 1, mejora después de la puesta en marcha |
29. Análisis de punto de equilibrio
Contribución por litro equivalente = precio de venta (0,86) − costo variable (0,48) = 0,38 USD. Unidades de punto de equilibrio = costo fijo ($365.000) ÷ contribución (0,38) = 960.526 L equivalente/año. Ingresos de punto de equilibrio = $826.053. Utilización de punto de equilibrio = 33,7% de la capacidad vendible.
Fuente: modelo base calculado, 2026.
30. Análisis de sensibilidad
| Variable probada | Resultado del VAN | Impacto vs VAN base |
|---|---|---|
| Precio de venta -10% | $40.572 | -$499.870 |
| Volumen de ventas/utilización -10% | $319.569 | -$220.873 |
| Leche cruda y envasado +10% | $261.445 | -$278.997 |
| Gastos operativos fijos +10% | $453.927 | -$86.515 |
| Costo de capital +10% | $455.442 | -$85.000 |
| Precio de venta +10% | $1,04m | $499.870 |
| Costo variable -10% | $819.439 | $278.997 |
Fuente: modelo de sensibilidad calculado, 2026.
Las variables críticas son el precio de venta, el costo de la leche cruda/envasado, la utilización de las ventas y la ejecución de la cadena de frío. El costo de la maquinaria es importante, pero las devoluciones de distribución repetidas o la baja calidad de la leche cruda pueden dañar la rentabilidad más rápido que un cambio moderado en el costo del equipo.
31. Requisitos legales y reglamentarios
Los requisitos normalmente incluyen el registro de la empresa, la aprobación del establecimiento de alimentos, la licencia de procesamiento de lácteos, los controles de recepción de leche cruda, las pruebas de productos, la aprobación de etiquetas, el cumplimiento de la cadena de frío, el registro fiscal, los permisos laborales, la aprobación ambiental y el permiso de aguas residuales. El Codex proporciona el contexto de las normas internacionales de lácteos, pero se requiere una revisión de la legislación alimentaria local antes de la producción [2].
32. Análisis de medio ambiente, salud y seguridad

Los problemas de EHS incluyen aguas residuales con carga orgánica, manejo de productos químicos para CIP, seguridad de calderas/agua caliente, seguridad del sistema de refrigeración, pisos mojados, quemaduras, movimiento de montacargas, trabajo en cámaras frigoríficas y riesgo de retirada de productos. El proyecto debe aplicar controles tipo HACCP, SOP de saneamiento, control de plagas, control de alérgenos y etiquetas, trazabilidad y gestión de aguas residuales.
33. Análisis y registro de riesgos
| Riesgo | Probabilidad | Impacto | Mitigación |
|---|---|---|---|
| Calidad o escasez de suministro de leche cruda | Media | Alta | Contratos con proveedores, enfriamiento en la recolección, pruebas de laboratorio entrantes |
| Falla de la cadena de frío | Media | Alta | Energía de respaldo, monitoreo de cámaras frigoríficas, transporte refrigerado |
| Lenta adopción minorista | Media | Alta | Acuerdos con distribuidores y muestreo previos al lanzamiento |
| Contaminación o evento de retirada | Baja-media | Alta | Controles tipo HACCP, validación de CIP, trazabilidad |
| Aumento del costo del empaque | Media | Media | Estrategia de empaque con múltiples proveedores |
| Retraso regulatorio | Media | Media | Permisos tempranos, revisión de etiquetas y documentación de laboratorio |
34. Cronograma de implementación
| Fase | Duración | Tareas clave |
|---|---|---|
| Localización de viabilidad | 2-4 semanas | Datos del país, precio de la leche cruda, validación minorista |
| Ingeniería y permisos | 1-2 meses | Diseño, licencia de alimentos, diseño de aguas residuales y servicios públicos |
| Cotización y adquisición de proveedores | 2-3 meses | Ofertas técnicas, contrato y fabricación |
| Obras civiles y servicios públicos | 2-4 meses | Drenaje, pisos, cámaras frigoríficas, energía, caldera/enfriadora |
| Instalación y puesta en marcha | 4-8 semanas | Instalación de máquinas, pruebas CIP, producción de prueba |
| Lanzamiento comercial | 1 mes | Incorporación de distribuidores, muestreo, lanzamiento minorista |
35. Fuentes y suposiciones
Registro de suposiciones
| Suposición | Valor | Base | Confianza | Efecto |
|---|---|---|---|---|
| Moneda | USD | Suposición del analista | Media | Todos los resultados financieros |
| Capacidad de la planta | 10.000 L/día de leche equivalente | Base de planificación estándar de fábrica de lácteos pequeña a mediana | Media | Alcance de ingresos y maquinaria |
| Horario de funcionamiento | 300 días/año, 95% de rendimiento vendible | Suposición de planificación de la industria | Media | Capacidad |
| Precio de venta | USD 0,86/L equivalente | Suposición de planificación de fábrica mezclada para leche y mezcla de yogur | Baja-media | Ingresos y margen |
| Costo variable | USD 0,48/L equivalente | Leche cruda, cultivos, azúcar/sabor, empaque, servicios públicos y consumibles de control de calidad | Media | Margen bruto |
| Inversión total | USD 0,85m | Base de costos estándar del proveedor de China más asignaciones de fábrica | Media | VAN, TIR y necesidad de financiación |
| Términos de la deuda | 60%, 9%, 5 años | Suposición del analista | Baja-media | Flujo de caja y DSCR |
Registro de fuentes
| Referencia | Organización | Fuente y URL | Datos utilizados | Fecha de acceso | Confianza |
|---|---|---|---|---|---|
| [1] | FAO | FAOSTAT / plataforma de datos de lácteos y ganado, https://www.fao.org/faostat/en/#data/QCL | Plataforma oficial de datos agrícolas y lácteos; se requiere localización por país | 2026-08-05 | Alta |
| [2] | FAO/OMS Codex Alimentarius | Lista de normas, https://www.fao.org/fao-who-codexalimentarius/codex-texts/list-standards/en/ | Contexto de normas lácteas que incluye términos lácteos y normas relacionadas con la leche | 2026-08-05 | Alta |
| [3] | USDA AMS | Dairy Market News, https://www.ams.usda.gov/market-news/dairy | Fuente de monitoreo de precios/mercado de lácteos; no se utiliza como precio local sin localización | 2026-08-05 | Media |
| [4] | Banco Mundial | API de datos del Banco Mundial, https://api.worldbank.org/ | Disponibilidad de datos económicos y demográficos; se requieren datos por país | 2026-08-05 | Alta |
| [5] | Made-in-China.com | Búsqueda de líneas de procesamiento de lácteos, https://www.made-in-china.com/products-search/hot-china-products/Dairy_Processing_Line.html | Precios de referencia de proveedores de China para equipos de procesamiento de lácteos | 2026-08-05 | Media |
| [6] | Made-in-China.com | Búsqueda de líneas de producción de yogur, https://www.made-in-china.com/products-search/hot-china-products/Yogurt_Production_Line.html | Precios de referencia de proveedores de China para equipos de producción de yogur | 2026-08-05 | Media |
| [7] | Cálculo del analista | Modelo transparente en este estudio | Cálculos de capacidad, inversión, ingresos, punto de equilibrio, VAN y TIR | 2026-08-05 | Media |
36. Sección de consulta
¿Necesita un estudio localizado de una fábrica de yogur y leche?
Para un informe bancable, confirme el país, la ciudad, el precio de la leche cruda, la mezcla de productos, los tamaños de empaque, el estado del edificio, las tarifas de servicios públicos, el plan de cadena de frío, la tasa impositiva, los términos de financiación y la cotización del proveedor. Rolangear puede apoyar la configuración de la línea de producción de lácteos, la selección de maquinaria, la planificación de la capacidad y la comparación de cotizaciones para proyectos de fábricas de yogur y leche.
Contactar a Rolangear37. Conclusión y recomendación final
La fábrica de yogur y leche es técnicamente factible y financieramente positiva según las suposiciones de costos estándar establecidas. El proyecto se beneficia de la demanda esencial de alimentos y los márgenes de valor agregado del yogur. Sin embargo, la recomendación es condicional: proceda a la siguiente etapa solo después de confirmar los contratos de suministro de leche cruda, los precios de venta locales, la distribución de la cadena de frío, los permisos, el estado del edificio, la solución de aguas residuales y la cotización formal del proveedor. Los próximos pasos de mayor prioridad son las verificaciones de precios del mercado local, las pruebas de laboratorio de leche cruda, la cotización de la línea, el diseño de la fábrica y los compromisos previos de los distribuidores.
Gráficos basados en datos
Fuente: modelo base calculado, supuestos de planificación de 2026. Unidad: millones de USD.
Fuente: modelo base calculado, supuestos de planificación de 2026. Unidad: miles de USD.
Fuente: modelo base calculado, supuestos de planificación de 2026. Unidad: porcentaje.
Equipos: 42,4%Edificio: 21,2%Servicios públicos: 14,1%Otros: 22,4%
Leche pasteurizada: 45,0%Yogur: 40,0%Yogur bebible: 15,0%