Estudio de Viabilidad para una Fábrica de Galletas
Estudio de viabilidad para una fábrica de galletas
Estudio de viabilidad profesional para una fábrica de galletas pequeña-mediana que produce galletas dulces simples, galletas sándwich, galletas saladas y paquetes de snacks de marca blanca. Debido a que no se suministró país, estado del edificio, receta del producto, cotización del proveedor o combinación de empaques, este informe utiliza supuestos de planificación transparentes en USD que deben localizarse antes de la aprobación de la inversión.
1. Resumen ejecutivo
El proyecto es una fábrica de galletas diseñada en torno a una línea de producción de 500 kg/hora que opera 8 horas/día y 300 días/año. El caso base asume un rendimiento vendible del 95% y una capacidad vendible anual de 1.140 toneladas. El plan de productos incluye galletas simples, galletas sándwich de crema, galletas saladas y paquetes de marca blanca para venta al por menor, al por mayor, escuelas y distribuidores.

Utilizando un precio de venta combinado ex-fábrica de USD 1850/tonelada y un costo variable de USD 980/tonelada, una inversión total de $1.05 millones y una aceleración del 50% al 90% de utilización, los ingresos del Año 5 alcanzan $1.90 millones y la ganancia neta del Año 5 alcanza $413,024. El modelo base produce un VAN de $226,539 a una tasa de descuento del 12% y una TIR del 19.1%. La utilización de punto de equilibrio es del 36.8%. El proyecto es financieramente positivo bajo los supuestos establecidos, pero la aprobación final depende del costo de la receta, el precio del empaque, los compromisos de los distribuidores, el costo de los servicios públicos/combustible, el estado del edificio y las cotizaciones confirmadas de la maquinaria.
2. Alcance y metodología del estudio
Este estudio de viabilidad cubre el concepto del proyecto, análisis del producto, indicadores económicos y ubicación del proyecto, indicadores del mercado objetivo, demanda, producción local, advertencias de importación y exportación, análisis de la competencia, brecha de mercado, FODA, marketing, precios, distribución, maquinaria, capacidad de producción, cotizaciones de proveedores, costos de materia prima, gastos operativos, servicios públicos, personal, inversión, financiación, estados financieros, indicadores, punto de equilibrio, sensibilidad, requisitos legales/regulatorios, salud y seguridad ambiental, riesgo, cronograma de implementación, fuentes, consulta y conclusión final.
La metodología combina un contexto agrícola y de estándares respaldado por fuentes, fórmulas de capacidad transparentes, supuestos prácticos de costos de maquinaria, un modelo financiero a cinco años y pruebas de sensibilidad. Las fuentes de la FAO y el Codex proporcionan el contexto de las materias primas y los estándares alimentarios, mientras que los costos de maquinaria e inversión se tratan como estimaciones de planificación presupuestaria en lugar de cotizaciones finales de proveedores [1][2][3][4][5].
3. Concepto y naturaleza del proyecto

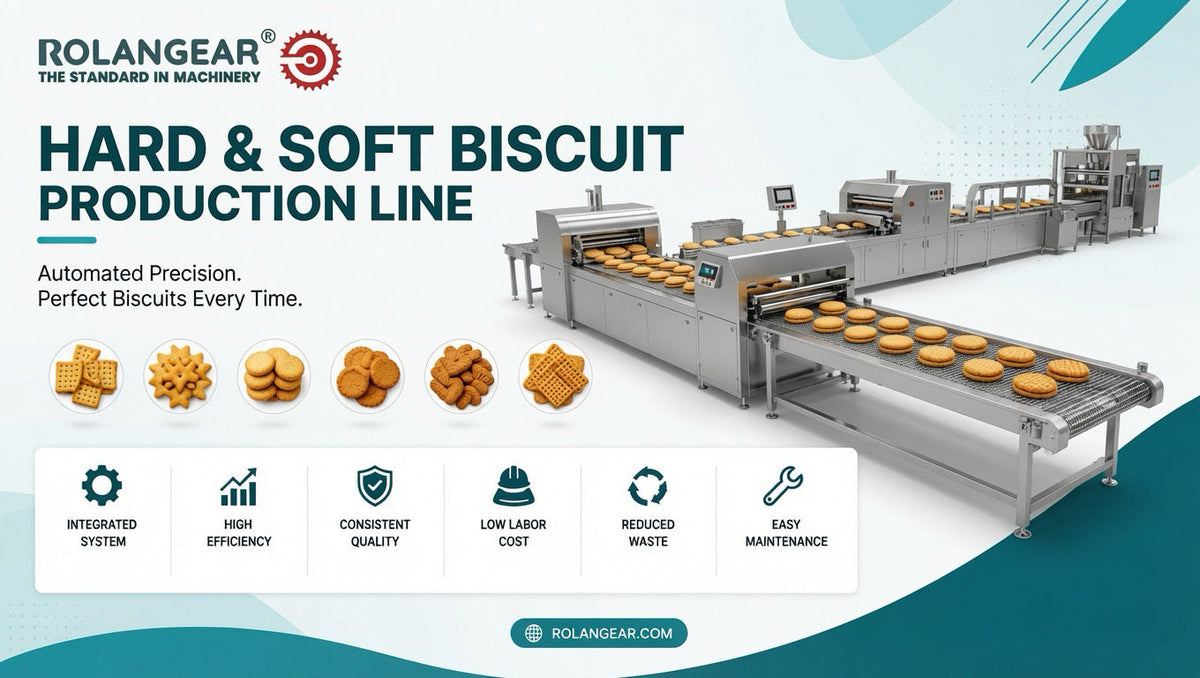
La naturaleza del proyecto es una planta industrial de panadería y procesamiento de snacks. La harina y los ingredientes se dosifican, se mezclan en masa, se forman mediante laminación o moldeado, se hornean en un horno de túnel, se enfrían, opcionalmente se rellenan con crema, se empacan, se codifican, se encartonan y se distribuyen. El modelo de negocio puede combinar paquetes minoristas de marca local, cajas al por mayor, suministro institucional y producción de marca blanca.
4. Análisis del producto y tabla de especificaciones del producto
Los productos principales son galletas y galletas saladas de larga duración. La formulación del producto, el etiquetado nutricional, las declaraciones de alérgenos, la vida útil, los aditivos alimentarios y las reglas de envasado deben verificarse localmente. El Codex proporciona el contexto de las normas alimentarias y de la harina de trigo, pero este estudio no pretende una certificación de producto verificada [2].
| Producto | Envase típico | Canal objetivo | Notas de calidad / almacenamiento |
|---|---|---|---|
| Galletas dulces simples | 50 g / 100 g / paquete familiar | Minoristas, escuelas, mayoristas | Control de humedad, textura, peso y vida útil |
| Galletas sándwich de crema | Paquetes pequeños / multipacks | Tiendas minoristas y de conveniencia | Precisión de depósito de crema y calidad del sellado del envase |
| Galletas saladas / crackers | Paquetes para minoristas y HORECA | Hogares, cafeterías, catering | Control de equilibrio sal/aceite y crocantez |
| Galletas de marca blanca | SKU específicos del minorista | Supermercados y distribuidores | Receta, etiqueta y especificaciones de cartón acordadas por el comprador |
5. Indicadores económicos y ubicación del proyecto
La ubicación debe seleccionarse en función del acceso a la materia prima, las rutas de distribución, la fiabilidad de los servicios públicos, la idoneidad del edificio para uso alimentario, la disponibilidad de mano de obra y el suministro de envases. Los indicadores económicos específicos del país deben agregarse a partir de conjuntos de datos oficiales una vez que se seleccione el país objetivo [1].
| Factor de ubicación | Peso | Condición preferida | Efecto sobre la viabilidad |
|---|---|---|---|
| Acceso a materia prima | 25% | Suministro fiable de harina, azúcar, aceite/grasa, leche en polvo y envases | Mayor efecto en el margen y tiempo de actividad |
| Acceso a la distribución | 20% | Cerca de mayoristas, minoristas y carreteras principales | Reduce el costo de logística y mejora la cobertura en estantes |
| Servicios públicos | 15% | Energía estable, gas/aceite térmico/combustible para hornos, agua y aire comprimido | Crítico para hornear y empacar |
| Idoneidad del edificio | 15% | Pisos aptos para alimentos, ventilación, control de plagas y espacio de expansión | Reduce el costo de configuración y el riesgo de cumplimiento |
| Habilidades laborales y de mantenimiento | 10% | Operarios, panaderos, empacadores y técnicos disponibles | Apoya la consistencia de la producción |
| Proveedores de envases | 8% | Película, cartones y etiquetas disponibles localmente | Controla el capital de trabajo |
| Entorno regulatorio | 7% | Requisitos claros de seguridad alimentaria y etiquetado | Reduce el retraso en el lanzamiento |
6. Indicadores del mercado objetivo
Los indicadores del mercado objetivo incluyen el consumo de snacks en el hogar, la demanda escolar e institucional, la disponibilidad en estantes de tiendas, el volumen mayorista de snacks, la presencia de galletas importadas y la capacidad de panaderías locales. El pronóstico del proyecto se basa en la capacidad porque no se proporcionaron datos del mercado del país.
| Capa de mercado | Definición | Tratamiento de planificación |
|---|---|---|
| TAM | Toda la demanda de galletas, bizcochos, crackers y snacks de panadería envasados en el país objetivo | No disponible completamente para el proyecto |
| SAM | Demanda alcanzable a través de los canales minoristas, mayoristas e institucionales planificados | Requiere validación del distribuidor |
| Mercado realmente obtenible | Volumen que una nueva planta puede capturar en cinco años | Limitado por precio, sabor, confianza en la marca y acceso a estanterías |
| Pronóstico de ventas del proyecto | Aumento gradual del 50% al 90% de utilización | Limitado por una capacidad vendible de 1,140 toneladas/año |
7. Análisis de la demanda
La demanda debe calcularse utilizando la población × consumo de snacks, el número de estantes de minoristas, los compromisos de compra de distribuidores, la demanda escolar/institucional y el potencial de sustitución de importaciones. En este modelo preliminar, las ventas esperadas siguen la fórmula: 500 kg/hora × 8 horas/día × 300 días/año = 1.200 toneladas de producción bruta. Producción vendible = 1.200 × 95% de rendimiento = 1.140 toneladas/año. Ventas del Año 1 = 1.140 × 50% = 570 toneladas.
La confianza es media para la fórmula de capacidad y baja-media para la absorción del mercado hasta que se completen las verificaciones de minoristas locales, distribuidores y competidores.
8. Análisis de la producción local

El análisis de la producción local debe identificar las plantas de galletas, panaderías, fabricantes de snacks existentes, empacadores de marca blanca y alternativas importadas. La producción local exacta no se indica porque no se proporcionó el país objetivo; debe investigarse con datos industriales oficiales, verificaciones de estantes minoristas y entrevistas a distribuidores.
9. Análisis de importación y exportación con advertencias de código HS
Los códigos HS probables incluyen el HS 1905 para pan, pastelería, tartas, galletas y otros productos de panadería. Este código es amplio y puede incluir productos más allá de las galletas, por lo que los datos comerciales amplios no deben tratarse como una demanda exacta de galletas sin la validación de la subpartida. Las verificaciones de importación/exportación a nivel de país deben usar datos de aduanas, UN Comtrade o ITC Trade Map después de confirmar el alcance del código HS.
10. Análisis de la competencia
| Tipo de competidor | Ejemplos para investigar localmente | Presión competitiva | Respuesta |
|---|---|---|---|
| Grandes marcas de snacks | Productores nacionales de galletas y bizcochos | Alta | Competir con tamaños de envase, distribución y calidad consistente |
| Panaderías regionales | Fábricas locales de galletas y panadería | Media-alta | Usar frescura, sabor local y relaciones mayoristas | Galletas importadas | Galletas envasadas regionales o internacionales | Media | Posicionar valor, disponibilidad y flexibilidad de marca blanca |
| Sustitutos | Pan, pasteles, obleas, patatas fritas y confitería | Media | Diferenciarse por precio por porción y vida útil |
| Nuevos participantes | Pequeñas panaderías y empacadores por contrato | Media | Asegurar distribuidores y empaques eficientes a tiempo |
11. Análisis de la brecha de mercado
La brecha de mercado debe ser igual a la demanda estimada más la sustitución de importaciones realista menos el suministro local fiable. Como faltan datos del país, la brecha no se cuantifica. En la práctica, la planta necesita vender 1.026 toneladas en el Año 5, por lo que los compromisos del distribuidor y el acceso a los estantes son más importantes que asumir que la demanda nacional total está disponible.
12. Análisis DAFO
| Fortalezas | Debilidades | Oportunidades | Amenazas |
|---|---|---|---|
| Producto de larga duración con amplia demanda diaria | Los márgenes dependen de los precios de la harina, grasas, azúcar y envases | Marca blanca, escuelas, mayoristas y exportaciones | Marcas fuertes y competencia de precios |
| Gama de productos y tamaños de envase flexibles | Requiere consistencia en la receta y control del horno | Las galletas sándwich de crema y los SKU premium aumentan el margen | Volatilidad de los costos de combustible y servicios públicos |
| Complejidad de fábrica moderada en comparación con alimentos refrigerados | Los cuellos de botella en la línea de envasado pueden limitar la producción | Posibilidad de fabricación por contrato para minoristas | Quejas de calidad por rotura o productos rancios |
13. Plan de marketing y promoción

El plan de marketing debe incluir la incorporación de distribuidores, muestreo minorista, paquetes escolares e institucionales, cajas al por mayor, SKU de precio, promociones de multipacks y ofertas de marca blanca. Los KPI incluyen puntos de venta activos, ventas de cajas por distribuidor, tasa de rotura de producción, margen bruto por SKU, tasa de quejas y repetición de compra.
14. Plan de precios
| Producto | Precio de planificación estándar ex-fábrica | Lógica de precios |
|---|---|---|
| Paquetes de venta al por menor de galletas simples | USD 1,500–1,900/tonelada de producto terminado | Producto de volumen con fuerte competencia de precios |
| Galletas sándwich de crema | USD 1,900–2,400/tonelada de producto terminado | Mayor valor debido a la crema y el empaque |
| Galletas saladas / crackers | USD 1,700–2,200/tonelada de producto terminado | Depende del sabor y del canal de precios |
| Galletas de marca blanca | Basado en contrato | Depende de la receta, el tamaño del paquete, el volumen del cartón y los términos de pago |
| Precio del modelo mixto | USD 1,850/tonelada de galletas terminadas | Utilizado para el modelo financiero base |
15. Plan de distribución
La distribución debe combinar distribuidores de supermercados, mercados mayoristas, escuelas, compradores de HORECA, tiendas de conveniencia y mayoristas regionales. Las galletas son estables en estantería, por lo que la distribución es más fácil que la de los alimentos de cadena de frío, pero los cartones, el control de roturas y los términos de crédito minorista deben gestionarse cuidadosamente.
16. Maquinaria, equipo y costos de la línea de producción
Los costos de la maquinaria se presentan como estimaciones de planificación presupuestaria para una fábrica de galletas pequeña a mediana. El costo final del equipo debe confirmarse a través de ofertas técnicas formales basadas en el tipo de galleta, capacidad, ancho/largo del horno, sistema de formado, requisito de sándwich, formato de empaque, nivel de automatización, alcance de servicios públicos, instalación y requisitos de destino [3][4][5].
| Máquina / equipo | Función | Estimación presupuestaria del costo del equipo |
|---|---|---|
| Manipulación de harina, mezcla y preparación de la masa | Dosificación de ingredientes y mezcla de masa | USD 45k–90k |
| Laminadora de masa / laminadora / moldeadora rotatoria | Formar galletas o galletas saladas | USD 80k–160k |
| Horno de túnel con quemador/sistema térmico | Hornear galletas continuamente | USD 140k–300k |
| Transportador de enfriamiento y apilador | Enfriar y alinear galletas antes de empacar | USD 60k–120k |
| Sistema para hacer sándwich de crema si es necesario | Agregar crema y galletas tipo sándwich | 50 000–120 000 USD |
| Máquinas de envoltura de flujo / multipack / encartonado | Envasado primario y secundario | 90 000–220 000 USD |
| Detector de metales, controladora de peso, codificación e inspección | Soporte de calidad y cumplimiento | 25 000–70 000 USD |
| Servicios públicos: compresor, caldera/aceite térmico, obras hidráulicas y eléctricas | Sistemas de soporte de fábrica | 80 000–160 000 USD |
17. Costos de edificios, instalaciones y construcción

La instalación debe incluir almacenamiento de materia prima, área de dosificación de ingredientes, sala de mezcla, línea de conformado, sala de horneado, sala de enfriamiento/ empaque, almacén de productos terminados, almacén de empaques, laboratorio de control de calidad, área de mantenimiento, áreas de higiene del personal, oficina, muelle de carga y zonificación de control de plagas. La ventilación y la gestión del calor alrededor del horno son importantes.
18. Capacidad de producción e idoneidad de la línea
La capacidad nominal es de 500 kg/hora de galletas terminadas antes de las pérdidas normales. Producción bruta anual = 500 kg/hora × 8 horas/día × 300 días = 1200 toneladas. Producción vendible = 1200 × 95 % = 1140 toneladas/año. Pueden producirse cuellos de botella en la mezcla, velocidad del horno, tiempo de enfriamiento, intercalado, velocidad de envasado, empaque de cartón, suministro de película y retrabajo de calidad.
19. Cotizaciones de proveedores y ofertas técnicas
No se proporcionó ninguna cotización de proveedor. Las ofertas finales de los proveedores deben confirmar la capacidad por tipo de producto, sistema de masa, método de conformado, especificaciones del horno, longitud de enfriamiento, velocidad de la máquina de envasado, carga eléctrica y de combustible, repuestos, instalación, capacitación, garantía e Incoterm.
20. Costos de materia prima

Las principales materias primas son harina de trigo, azúcar, aceite/grasa o manteca, jarabe de glucosa, leche en polvo, cacao/saborizantes, sal, agentes leudantes, ingredientes para crema, película de envasado, cartones, etiquetas y consumibles de limpieza. El costo variable base es de 980 USD/tonelada de galletas terminadas, incluidos ingredientes, envasado, combustible, mano de obra directa y desechos normales.
21. Requisitos y gastos operativos
Los gastos operativos fijos anuales se estiman en 280 000 USD antes de la depreciación. Esto cubre la administración, supervisión de producción, control de calidad, mantenimiento, ventas/administración, seguros, seguridad, costos de oficina, marketing básico y gastos generales no variables normales.
22. Requisitos de servicios públicos

| Servicio público | Requisito típico a confirmar | Efecto de viabilidad |
|---|---|---|
| Electricidad | Energía trifásica para mezcladoras, transportadores y línea de envasado | Controla el tiempo de actividad |
| Combustible para horno / gas / diésel / calefacción eléctrica | Horno de túnel y sistema térmico | Principal factor de costo |
| Aire comprimido | Máquinas de envasado, actuadores y limpieza | Afecta la estabilidad de la línea |
| Agua | Limpieza e higiene del personal | Requisito de seguridad alimentaria |
| Ventilación | Extracción de calor y área de envasado cómoda | Apoya la productividad laboral |
| Manejo de residuos | Residuos de masa, residuos de envases y control de polvo | Requisito de EHS e higiene |
23. Estructura organizativa y de gestión
| Rol | Número de empleados | Responsabilidad principal |
|---|---|---|
| Gerente general | 1 | Operaciones, ventas y finanzas |
| Gerente de producción / tecnólogo de panadería | 1 | Coordinación de recetas, procesos, rendimiento y calidad |
| Supervisores de turno | 2 | Ejecución de la producción |
| Operadores de mezcla/conformado/horno | 10 | Preparación de masa, conformado y horneado |
| Operadores de empaque | 14 | Envoltura de flujo, multiempaque y encartonado |
| Personal de calidad/laboratorio | 3 | Registros de humedad, peso, sellado, alérgenos y liberación |
| Mantenimiento y servicios públicos | 3 | Horno, mezcladoras, transportadores y máquinas de envasado |
| Almacén/logística | 5 | Materias primas, empaques y despacho |
| Ventas/administración/finanzas | 5 | Pedidos, contabilidad y servicio al cliente |
24. Costos de inversión
| Elemento de inversión | Estimación estándar | Base |
|---|---|---|
| Acondicionamiento de edificios, pisos aptos para alimentos, ventilación y almacenamiento | 180 000 $ | Estimación de planificación; excluye la compra de terrenos |
| Línea de formado, horneado, enfriamiento y envasado de galletas | 470 000 $ | Paquete de línea de procesamiento presupuestado |
| Servicios públicos: sistema de combustible de horno, compresor, electricidad y agua | 130 000 $ | Asignación de servicios públicos auxiliares |
| Equipos de laboratorio, control de calidad, codificación, manipulación y taller | 45 000 $ | Equipos de apoyo |
| Flete, aranceles, instalación, capacitación y puesta en marcha | 80 000 $ | Asignación dependiente del destino |
| Gastos preoperativos, permisos y lanzamiento | 35 000 $ | Estimación de planificación |
| Reserva de contingencia | 60 000 $ | Reserva aproximada |
| Capital de trabajo inicial | 50 000 $ | Harina, azúcar, grasas, envasado y cuentas por cobrar |
| Inversión total del proyecto | 1,05 millones $ | Subtotal calculado |
25. Requisitos y condiciones de financiación

La financiación base asume un 40 % de capital propio y un 60 % de deuda. El requisito de capital propio es de 420 000 $ y el requisito de préstamo es de 630 000 $. Las condiciones del préstamo se modelan con un interés anual del 9 %, reembolso de capital a cinco años en cuotas iguales y sin período de gracia. Las condiciones finales dependen del prestamista, la garantía y el perfil del patrocinador.
26. Previsiones de ingresos y ventas
| Año | Utilización | Volumen de ventas, toneladas | Ingresos | Beneficio neto | DSCR |
|---|---|---|---|---|---|
| A1 | 50.0% | 570 | 1,05 millones $ | 59 360 $ | 0,79x |
| A2 | 65.0% | 741 | 1,37 millones $ | 187 448 $ | 1,59x |
| A3 | 75.0% | 855 | 1,58 millones $ | 275 864 $ | 2,26x |
| A4 | 85.0% | 969 | 1,79 millones $ | 364 280 $ | 3,02x |
| A5 | 90.0% | 1026 | 1,90 millones $ | 413 024 $ | 3,63x |
El escenario optimista supone una incorporación más rápida de distribuidores, una utilización del 95 % en el año 5 y una mezcla de galletas tipo sándwich de mayor valor. El escenario conservador supone una cotización minorista más lenta, una utilización del 75 % en el año 5, un precio de venta un 5 % más bajo y mayores costos de harina y envasado.
27. Estados financieros
| USD | A1 | A2 | A3 | A4 | A5 |
|---|---|---|---|---|---|
| Ingresos | 1,05 millones $ | 1,37 millones $ | 1,58 millones $ | 1,79 millones $ | 1,90 millones $ |
| Costo de bienes vendidos | 558 600 $ | 726 180 $ | 837 900 $ | 949 620 $ | 1,01 millones $ |
| Beneficio bruto | 495 900 $ | 644 670 $ | 743 850 $ | 843 030 $ | 892 620 $ |
| EBITDA | 215 900 $ | 364 670 $ | 463 850 $ | 563 030 $ | 612 620 $ |
| Depreciación | 85 000 $ | 85 000 $ | 85 000 $ | 85 000 $ | 85 000 $ |
| EBIT | 130 900 $ | 279 670 $ | 378 850 $ | 478 030 $ | 527 620 $ |
| Intereses | 56 700 $ | 45 360 $ | 34 020 $ | 22 680 $ | 11 340 $ |
| Impuestos | 14 840 $ | 46 862 $ | 68 966 $ | 91 070 $ | 103 256 $ |
| Beneficio neto | 59 360 $ | 187 448 $ | 275 864 $ | 364 280 $ | 413 024 $ |
| USD | A0 | A1 | A2 | A3 | A4 | A5 |
|---|---|---|---|---|---|---|
| Capital/flujo de caja del proyecto | -420 000 $ | 18 360 $ | 146 448 $ | 234 864 $ | 323 280 $ | 372 024 $ |
| Flujo de caja acumulado | -420 000 $ | -401 640 $ | -255 192 $ | -20 328 $ | 302 952 $ | 674 976 $ |
| Amortización del principal de la deuda | - | 126 000 $ | 126 000 $ | 126 000 $ | 126 000 $ | 126 000 $ |
| Deuda final | - | 504 000 $ | 378 000 $ | 252 000 $ | 126 000 $ | 0 $ |
| USD | A1 | A2 | A3 | A4 | A5 |
|---|---|---|---|---|---|
| Activos fijos netos | 675 000 $ | 590 000 $ | 505 000 $ | 420 000 $ | 335 000 $ |
| Capital de trabajo y efectivo | 50 000 $ | 50 000 $ | 50 000 $ | 352 952 $ | 724 976 $ |
| Activos totales | 725 000 $ | 640 000 $ | 555 000 $ | 772 952 $ | 1,06 millones $ |
| Deuda | 504 000 $ | 378 000 $ | 252 000 $ | 126 000 $ | 0 $ |
| Capital y ganancias retenidas | 221 000 $ | 262 000 $ | 303 000 $ | 646 952 $ | 1,06 millones $ |
| Pasivos más capital | 725 000 $ | 640 000 $ | 555 000 $ | 772 952 $ | 1,06 millones $ |
28. Indicadores y análisis financieros
| Indicador | Fórmula / base | Resultado base | Interpretación |
|---|---|---|---|
| Margen bruto | (Ingresos - Costo de bienes vendidos) / Ingresos | 47,0 % | Saludable si se controlan los costos de ingredientes y envases |
| Margen de contribución | Precio - costo variable | 870 USD/tonelada | Utilizado para el punto de equilibrio |
| Cantidad de equilibrio | Costo fijo / contribución | 420 toneladas/año | Requiere una utilización del 36,8 % |
| ROI | Beneficio neto medio / inversión | 24,8 % | Positivo después del período de arranque bajo supuestos presupuestarios |
| VAN | FCFF sin apalancamiento descontado al 12 % | 226 539 $ | Positivo pero sensible al precio de venta y las materias primas |
| TIR | Tasa de descuento donde el VAN = 0 | 19,1 % | Por encima de la tasa de descuento del 12 % en el caso base |
| Período de recuperación | Recuperación acumulada de efectivo apalancado | Durante el año 4 | Requiere ejecución del distribuidor y control de calidad |
| Relación deuda-capital | Deuda / capital | 1,50x | Apalancamiento moderado |
| DSCR | Flujo de caja operativo / servicio de la deuda | A1 0,79x; A5 3,63x | Débil al principio, mejora con la utilización |
29. Análisis del punto de equilibrio
Contribución por tonelada = precio de venta (1850) − costo variable (980) = 870 USD. Cantidad de equilibrio = costo fijo más depreciación (365 000 $ ) ÷ contribución (870) = 420 toneladas/año. Ingresos de equilibrio = 776 149 $. Utilización de equilibrio = 36,8 % de la capacidad vendible.
Fuente: modelo de caso base calculado, 2026.
30. Análisis de sensibilidad
| Variable probada | Resultado del VAN | Impacto vs VAN base |
|---|---|---|
| Precio de venta -10 % | -203 581 $ | -430 120 $ |
| Volumen de ventas/utilización -10 % | 24 266 $ | -202 273 $ |
| Harina, grasa y azúcar +10 % | -1308 $ | -227 848 $ |
| Gastos operativos fijos +10% | $145,792 | -$80,747 |
| Costo de capital +10% | $121,539 | -$105,000 |
| Retraso en el lanzamiento / lentitud en la cotización | -$417,143 | -$643,683 |
| Precio de venta +10% | $656,660 | $430,120 |
| Costo variable -10% | $454,387 | $227,848 |
Fuente: modelo de sensibilidad calculado, 2026.
Las variables críticas son el precio de venta, el costo de harina/grasa/azúcar, el costo de empaque, la utilización de ventas, el costo de combustible del horno y la velocidad de lanzamiento del distribuidor.
31. Requisitos Legales y Regulatorios
Los requisitos normalmente incluyen registro de la empresa, licencia de procesamiento de alimentos, aprobación de etiquetado de productos, declaración de alérgenos, plan de seguridad alimentaria, normas de salud para trabajadores, registro fiscal, aprobación ambiental y revisión de empaque/etiqueta. Se requiere una revisión de la legislación alimentaria local antes de la producción [2].
32. Análisis Ambiental, de Salud y Seguridad

Los problemas de EHS incluyen polvo de harina, calor del horno, riesgo de quemaduras, cintas transportadoras en movimiento, protección de máquinas de envasado, control de alérgenos, productos químicos de limpieza, control de plagas, residuos de envases y seguridad contra incendios. El proyecto debe implementar controles tipo HACCP, segregación de alérgenos, detección de metales, trazabilidad, pruebas de humedad y SOP de saneamiento.
33. Análisis de Riesgos y Registro de Riesgos
| Riesgo | Probabilidad | Impacto | Mitigación |
|---|---|---|---|
| Aumento del precio de la harina, el azúcar o la grasa | Medio | Alto | Contratos con proveedores y revisión del costo de la receta |
| Escasez de material de embalaje | Medio | Medio-alto | Múltiples proveedores de film/cartón y stock de seguridad |
| Aumento del precio del combustible del horno | Medio | Medio | Funcionamiento eficiente del horno y mantenimiento preventivo |
| Rotura del producto o calidad rancia | Medio | Alto | Control de humedad, comprobaciones del sellado del envase y SOP de manipulación |
| Lenta aceptación del minorista | Medio | Alto | Acuerdos previos con distribuidores y muestreo de productos |
| Incidente de seguridad alimentaria o alérgenos | Bajo-medio | Alto | Controles tipo HACCP, etiquetado de alérgenos y trazabilidad |
34. Cronograma de Implementación
| Fase | Duración | Tareas clave |
|---|---|---|
| Localización de la viabilidad | 2–4 semanas | Datos del país, precios de ingredientes, validación de mercado |
| Ingeniería y permisos | 1–2 meses | Diseño, licencia alimentaria, diseño de servicios públicos y ventilación |
| Cotización y adquisición de proveedores | 2–3 meses | Ofertas técnicas, contrato y fabricación |
| Obras civiles y servicios públicos | 2–4 meses | Pisos, ventilación, combustible del horno, energía y almacenamiento |
| Instalación y puesta en marcha | 4–8 semanas | Instalación de la línea, horneado de prueba y pruebas de envasado |
| Lanzamiento comercial | 1 mes | Incorporación de distribuidores, muestreo minorista y aumento de SKU |
35. Fuentes y Supuestos
Registro de supuestos
| Supuesto | Valor | Base | Confianza | Efecto |
|---|---|---|---|---|
| Moneda | USD | Supuesto del analista | Medio | Todos los resultados financieros |
| Capacidad de la línea | 500 kg/hora × 8 horas/día × 300 días/año | Base de planificación estándar para una fábrica de galletas de tamaño pequeño a mediano | Medio | Capacidad |
| Rendimiento vendible | 95% después de pérdida de proceso y rotura | Estimación del analista | Medio | Ingresos y COGS |
| Producción anual vendible | 1,140 toneladas/año | Calculado a partir de la capacidad y el rendimiento | Medio | Pronóstico de ventas |
| Precio de venta | USD 1,850/tonelada de galletas terminadas | Supuesto de planificación de precio promedio ex-fábrica | Bajo-medio | Ingresos y margen |
| Costo variable | USD 980/tonelada de galletas terminadas | Harina, azúcar, grasa/aceite, leche en polvo, sabores, envases, combustible y mano de obra directa | Medio | Margen bruto |
| Inversión total | USD 1.05m | Base de costo presupuestario de maquinaria más asignaciones de fábrica | Medio | VAN, TIR y necesidad de financiación |
| Términos de la deuda | 60%, 9%, 5 años | Supuesto del analista | Bajo-medio | Flujo de caja y DSCR |
Registro de fuentes
| Ref | Organización | Fuente y URL | Datos utilizados | Fecha de acceso | Confianza |
|---|---|---|---|---|---|
| [1] | FAO | Plataforma FAOSTAT de cultivos y agricultura, https://www.fao.org/faostat/en/#data/QCL | Plataforma oficial de datos de cultivos y materias primas; se requiere localización por país | 2026-08-05 | Alta |
| [2] | FAO/OMS Codex Alimentarius | Lista de normas, https://www.fao.org/fao-who-codexalimentarius/codex-texts/list-standards/en/ | Contexto de la harina de trigo y las normas alimentarias | 2026-08-05 | Alta |
| [3] | Referencia del mercado de proveedores | Revisión del precio de máquinas de galletas y líneas de producción | Evaluación comparativa del costo presupuestario de maquinaria para equipos de procesamiento de galletas | 2026-08-05 | Medio |
| [4] | Referencia del mercado de proveedores | Revisión de la categoría de línea de producción de galletas | Evaluación comparativa de la categoría de maquinaria presupuestaria para la línea de formado, horneado y envasado | 2026-08-05 | Medio |
| [5] | Referencia del mercado de proveedores | Revisión del precio de la línea de producción de galletas | Verificación de referencia de proveedor presupuestaria; no tratada como una cotización final | 2026-08-05 | Bajo-medio |
| [6] | Cálculo del analista | Modelo transparente en este estudio | Cálculos de capacidad, inversión, ingresos, punto de equilibrio, VAN y TIR | 2026-08-05 | Medio |
36. Sección de Consulta
¿Necesita un estudio de fábrica de galletas localizado?
Para un informe bancable de fábrica de galletas, confirme el país, los tipos de galletas objetivo, las recetas, los tamaños de envase, los costos de harina e ingredientes, el estado del edificio, la tarifa de combustible del horno, la tasa impositiva, los términos de financiación y la cotización del proveedor. Rolangear puede ayudar con la configuración de la línea de producción de galletas, la selección de maquinaria, la planificación de la capacidad y la comparación de presupuestos.
Contactar a Rolangear37. Conclusión final y recomendación

La fábrica de galletas es técnicamente factible y financieramente positiva bajo los supuestos presupuestarios establecidos. La inversión es más atractiva cuando la planta asegura un suministro confiable de harina/envases, controla la eficiencia del horno y el envasado, desarrolla SKU a precios accesibles y firma compromisos con distribuidores antes del lanzamiento. La recomendación es proceder a la validación localizada antes de la inversión final: confirmar los precios de los ingredientes, los precios del mercado objetivo, los costos de los envases, los costos de combustible/energía, la condición del edificio, las recetas de los productos y la cotización formal del proveedor.
Gráficos basados en datos
Fuente: modelo de caso base calculado, supuestos de planificación 2026. Unidad: millones de USD.
Fuente: modelo de caso base calculado, supuestos de planificación 2026. Unidad: miles de USD.
Fuente: modelo de caso base calculado, supuestos de planificación 2026. Unidad: porcentaje.
Fuente: modelo de caso base calculado, supuestos de planificación 2026. Unidad: toneladas.
Equipo: 44.8%Construcción: 17.1%Servicios: 12.4%Otros: 25.7%
Fuente: modelo de inversión presupuestaria del analista, 2026.
Galletas simples: 45.0%Galletas sándwich: 30.0%Crackers: 15.0%Marca blanca: 10.0%
Fuente: modelo de inversión presupuestaria del analista, 2026.