Estudio de viabilidad para una fábrica de producción de zumos
Estudio de viabilidad para una fábrica de producción de zumos
Estudio de viabilidad profesional para una fábrica de producción de zumos de tamaño pequeño a mediano, que produce bebidas de zumo de frutas embotelladas, bebidas de néctar, zumos pasteurizados y envases de marca blanca. Dado que no se suministró información sobre el país, la receta, el precio de los materiales, la tarifa de los servicios públicos, el estado del edificio o las cotizaciones de los proveedores, este informe utiliza supuestos de planificación transparentes en USD que deben localizarse antes de la aprobación de la inversión.
Mapa del estudio
1. Resumen ejecutivo
El proyecto es una fábrica de producción de zumos que elabora bebidas de zumo de frutas embotelladas, bebidas tipo néctar, bebidas de frutas mezcladas, zumos pasteurizados y envases de bebidas de marca blanca. El caso base asume una línea de procesamiento y llenado de 3.000 L/hora, 8 horas/día, 300 días de operación/año y un rendimiento vendible del 95%, lo que da como resultado 6.840.000 litros/año de producto vendible.

Utilizando un precio de venta promedio ex-fábrica de 0,55 USD/litro, un costo variable de 0,34 USD/litro y una inversión total de 1,43 millones de USD, los ingresos del Año 5 alcanzan los 3,39 millones de USD y el beneficio neto del Año 5 alcanza los 543.682 USD. El VPN base es de 312.053 USD a una tasa de descuento del 12%, la TIR estimada es del 19,2% y la utilización de equilibrio es del 37,9%.
2. Alcance y metodología del estudio
Este estudio cubre el mercado, aspectos técnicos, operativos, de personal, inversión, financiación, ingresos, estados financieros, indicadores, punto de equilibrio, sensibilidad, aspectos legales, EHS, riesgos, implementación, fuentes, consultas y recomendación final. Los indicadores del Banco Mundial apoyan el contexto macroeconómico y la localización de la demanda [1][2]. FAOSTAT apoya la localización del suministro de cultivos y frutas [3]. Las normas del Codex para zumos de frutas, el HACCP de la FDA para zumos, el Capítulo 20 del SA y las directrices dietéticas de la OMS proporcionan referencias de producto, seguridad, comercio y contexto de la demanda [4][5][6][7].
3. Concepto y naturaleza del proyecto
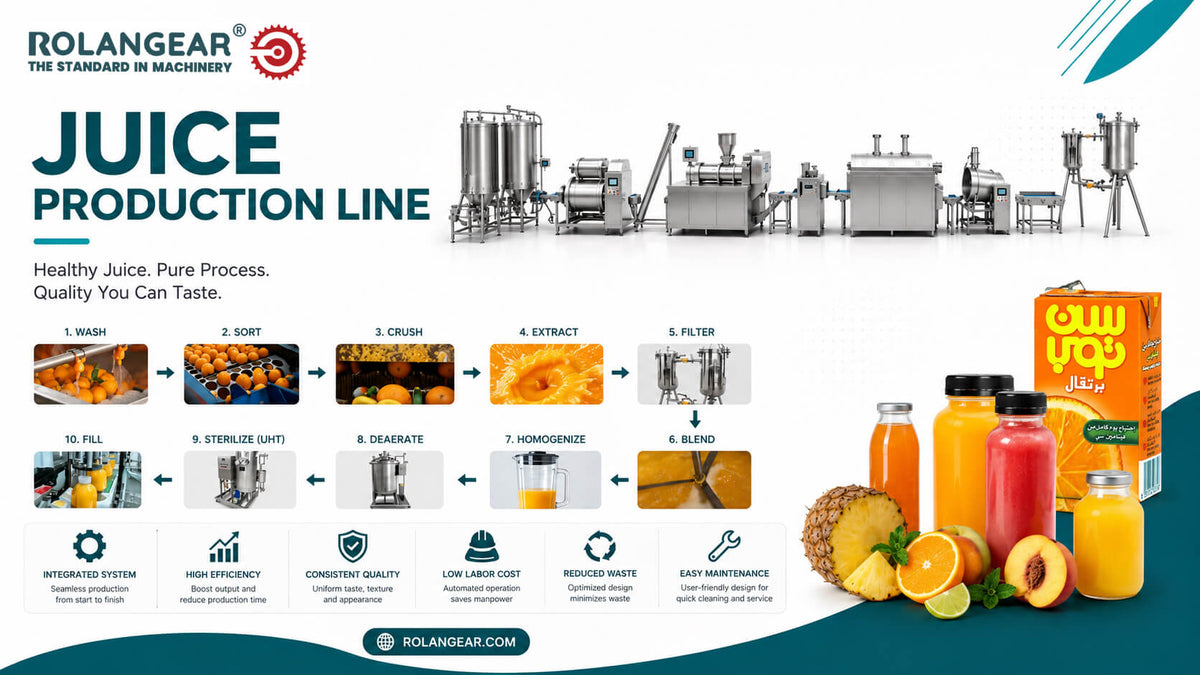
El proyecto es una fábrica de procesamiento de alimentos y bebidas. Se recibe pulpa de fruta, concentrado de jugo o fruta fresca, se inspecciona, se lava cuando corresponda, se extrae o se diluye/mezcla, se filtra, se estandariza, se pasteuriza, se llena, se tapa, se etiqueta, se empaca y se distribuye. El modelo de negocio puede combinar bebidas embotelladas para venta al por menor, suministro a HORECA, canales escolares/institucionales y producción de marca blanca.

4. Análisis del producto y tabla de especificaciones del producto
Las especificaciones del producto incluyen el tipo de fruta, el porcentaje de jugo, grados Brix, acidez, contenido de pulpa, conservantes si están permitidos, tamaño de la botella, cierre, vida útil, condiciones de almacenamiento y etiquetado. No declare "100% jugo", orgánico, sin conservantes o fortificado a menos que la formulación y la certificación estén verificadas.
| Producto | Especificación típica | Cliente objetivo | Notas de calidad |
|---|---|---|---|
| Bebida de zumo de frutas embotellada | Botellas de PET o vidrio de 200 ml a 1 L | Comercio minorista y supermercados | Control de Brix, acidez, sabor y vida útil |
| Bebidas tipo néctar | Mango, guayaba, durazno o frutas mezcladas | Supermercados, escuelas, cafeterías | Estabilidad y viscosidad de la pulpa |
| Zumo pasteurizado | Producto fresco o a base de concentrado | Hoteles, restaurantes, comercio minorista premium | Se deben verificar las reglas de cadena de frío o estabilidad en estante |
| Envases de zumo de marca blanca | Botella, etiqueta y cartón específicos del comprador | Cadenas minoristas y distribuidores | Aprobación de diseño, código de barras y receta |
| Zumo a granel / Envases HORECA | Botellas más grandes o bag-in-box, según se seleccione | Restaurantes e instituciones | Empaque y entrega rentables |
5. Indicadores económicos y ubicación del proyecto
La demanda de zumo está ligada a la población, el desarrollo minorista, el ingreso disponible, la demanda de escuelas/HORECA, el turismo, la disponibilidad de fruta y la competencia de bebidas carbonatadas, agua y bebidas lácteas. Los indicadores de población y manufactura del Banco Mundial ayudan a seleccionar los mercados objetivo [1][2]. La ubicación debe priorizar el suministro de fruta o concentrado, agua limpia, servicios públicos, proveedores de envases, almacenamiento en frío/seco y rutas de distribución.
| Factor | Peso | Condición preferida | Efecto |
|---|---|---|---|
| Suministro de fruta/concentrado | 24% | Cerca de fincas frutales, proveedores de pulpa, importadores de concentrados o puertos | Controla el costo y la continuidad del producto |
| Agua y servicios públicos | 18% | Agua tratada confiable, energía, vapor/agua caliente y aire comprimido | Afecta la seguridad alimentaria y el tiempo de actividad |
| Rutas de distribución | 16% | Cerca de supermercados, escuelas, HORECA y mayoristas | Mejora el costo de entrega |
| Edificio de grado alimenticio | 15% | Drenaje, superficies lavables y control de plagas | Reduce el riesgo de cumplimiento |
| Suministro de envases | 11% | Botellas, tapas, etiquetas, cartones y film retráctil disponibles | Controla el capital de trabajo |
| Disponibilidad de mano de obra y control de calidad | 9% | Tecnólogo de alimentos, operadores y personal de control de calidad | Apoya la calidad |
| Claridad regulatoria | 7% | Normas claras de licencias y etiquetado de alimentos | Reduce el retraso en el lanzamiento |
6. Indicadores del mercado objetivo con separación de TAM, SAM y mercado obtenible de forma realista
| Capa | Definición | Tratamiento de la planificación |
|---|---|---|
| TAM | Toda la demanda de jugo embotellado, néctar, bebida de frutas y bebidas similares en el país objetivo | No está completamente disponible para una sola fábrica |
| SAM | Demanda alcanzable a través de minoristas, HORECA, escuelas y distribuidores planificados | Requiere validación de canal local |
| Mercado obtenible de forma realista | Volumen que una nueva fábrica de zumos puede capturar en cinco años | Limitado por la marca, el precio, el acceso a los estantes y la red de rutas |
| Previsión de ventas del proyecto | Aumento hasta 6.156.000 litros/año para el año 5 | Previsión basada en la capacidad, no una afirmación de cuota de mercado |
7. Análisis de la demanda
Dado que no se proporcionó ningún país, este informe utiliza una previsión basada en la capacidad. Fórmula: 3.000 L/hora × 8 horas/día × 300 días/año × 95% de rendimiento = 6.840.000 litros/año. Las ventas del Año 1 son 3.420.000 litros; las ventas del Año 5 son 6.156.000 litros. La demanda local deberá calcularse posteriormente a partir de la población × consumo anual de jugo, el número de puntos de venta minoristas, clientes de escuelas/HORECA, consumo aparente y entrevistas con distribuidores.

8. Análisis de la producción local
El análisis de la producción local debe identificar empresas nacionales de bebidas, embotelladoras de concentrados de zumo, procesadores de zumos frescos, marcas de lácteos/zumos, envasadores de marca blanca, marcas de zumos importados y proveedores informales de zumos frescos. La producción local exacta no se indica porque no se proporcionó ningún país; debe verificarse a través de registros de la industria alimentaria, comprobaciones en tiendas, entrevistas con distribuidores y datos comerciales.
9. Análisis de importación y exportación con advertencias sobre los códigos SA
Los códigos SA probables se encuentran en el Capítulo 20 para preparaciones de hortalizas, frutas, frutos secos u otras partes de plantas; los zumos de frutas y hortalizas se revisan comúnmente bajo el SA 2009, pero las subpartidas nacionales separan los zumos de naranja, manzana, uva y otros [6]. El SA 2009 puede incluir concentrados y diferentes tipos de zumos, por lo que los datos comerciales no deben tratarse como una demanda exacta de los productos embotellados terminados del proyecto sin la validación de las subpartidas.
10. Análisis de la competencia
| Tipo de competidor | Ejemplos a investigar localmente | Presión | Respuesta |
|---|---|---|---|
| Grandes empresas de bebidas | Marcas nacionales de zumos y refrescos | Alta | Competir con sabores locales, precio y servicio de distribuidor |
| Pequeños procesadores de zumos | Productores locales de zumos y néctares embotellados | Media-alta | Mejorar la consistencia, el etiquetado y la vida útil |
| Marcas de zumos importadas | Productos de zumos premium y regionales | Media | Ofrecer un suministro local más fresco y paquetes de valor |
| Sustitutos | Agua, refrescos, bebidas lácteas, bebidas en polvo | Alta | Posicionarse por sabor, contenido de fruta y valor del envase |
| Nuevos participantes | Operadores de líneas de llenado que añaden SKU de zumos | Media | Asegurar recetas, distribuidores y envases con antelación |
11. Análisis de la brecha de mercado
La brecha de mercado debe ser igual a la demanda estimada de jugo menos la producción local confiable y las importaciones, ajustada por las bebidas sustitutas y el acceso a los estantes. En este modelo preliminar, la fábrica necesita vender 6.156.000 litros para el Año 5. Esto requiere compromisos de los distribuidores, muestreo minorista, pruebas en escuelas/HORECA y pruebas de precios antes de la aprobación final.

12. Análisis DAFO
| Fortalezas | Debilidades | Oportunidades | Amenazas |
|---|---|---|---|
| Amplia demanda de bebidas y sabores flexibles | Requiere estricta seguridad alimentaria y control de vida útil | Marca blanca, escuelas y canales HORECA | Volatilidad de precios de fruta/concentrado y envases |
| Complejidad de procesamiento moderada | La construcción de marca y la inclusión en minoristas llevan tiempo | Sabores de frutas locales y packs de valor | Fuertes competidores de bebidas |
| Línea escalable y múltiples tamaños de botella | Las devoluciones pueden aumentar si la vida útil es deficiente | Sustitución de importaciones y promociones estacionales | Presión regulatoria o de etiquetado de azúcar |
13. Plan de marketing y promoción
El plan de marketing debe centrarse en el muestreo de productos, la inclusión en tiendas minoristas, los márgenes para distribuidores, los paquetes para escuelas/instituciones, el suministro a HORECA, las ofertas de marca blanca, los sabores de temporada y la visibilidad en el punto de venta. Los KPI incluyen puntos de venta activos, pedidos repetidos, devoluciones, tasa de quejas, consistencia de Brix, rendimiento de producción, tasa de cumplimiento de entregas y días de cobro.
14. Plan de precios
| Producto | Precio de venta planificado | Lógica de precios |
|---|---|---|
| Bebida de zumo de frutas, botella de PET | USD 0,45–0,65/L | Línea principal de valor por tamaño de botella y contenido de fruta |
| Bebida tipo néctar | USD 0,50–0,75/L | El precio se basa en la pulpa, los grados Brix y el costo de la fruta |
| Zumo pasteurizado premium | USD 0,80–1,40/L | La cadena de frío y un mayor contenido de fruta pueden justificar un precio premium |
| Botellas de marca blanca | Basado en contrato | Depende de la receta, el envase, la etiqueta y el volumen |
| Precio de modelo combinado | USD 0,55/L | Utilizado para el modelo financiero base |
15. Plan de distribución
La distribución debe combinar mayoristas, supermercados, minimercados, escuelas, cafeterías, restaurantes, hoteles y compradores institucionales seleccionados. La planificación de rutas debe controlar el daño del producto, la rotación de la vida útil, las devoluciones, la exposición al crédito y las necesidades de refrigeración, cuando corresponda.
16. Maquinaria, equipo y costos de la línea de producción

Los costos de la maquinaria son estimaciones presupuestarias de planificación, no cotizaciones de proveedores. El costo final depende del procesamiento de fruta fresca versus concentrado, el método de pasteurización, el tipo de botella, la velocidad de llenado, el sistema CIP, la etiquetadora, la automatización del empaque y el destino.
| Máquina/equipo | Función | Estimación presupuestaria |
|---|---|---|
| Sistema de lavado, clasificación y extracción/pulpeado de frutas | Preparación de fruta fresca cuando sea aplicable | 90k–220k USD |
| Mezcla, jarabe de azúcar y tanques de mezcla | Preparación y estandarización de recetas | 70k–160k USD |
| Herramientas de filtración, homogeneización y desaireación | Control de textura y calidad | 60k–150k USD |
| Pasteurizador y sistema de retención | Tratamiento térmico y control de vida útil | 120k–280k USD |
| Línea de enjuague, llenado y tapado de botellas | Operación de llenado primario | 180k–420k USD |
| Etiquetado, codificación de fecha y empaque retráctil/en caja | Empaque final | 90k–230k USD |
| CIP, tratamiento de agua, caldera/enfriador/compresor | Servicios públicos de grado alimenticio | 110k–260k USD |
17. Costos de edificio, instalaciones y construcción
Las instalaciones deben incluir recepción de fruta cruda o concentrado, almacenamiento de ingredientes, área de tratamiento de agua, sala de procesamiento, sala de llenado, almacén de empaque, almacén de productos terminados, laboratorio de control de calidad, área de CIP, manejo de aguas residuales, área de higiene del personal, oficina y bahía de despacho. Los pisos, el drenaje, las superficies lavables, la ventilación y el control de plagas son importantes.
18. Capacidad de producción e idoneidad de la línea

La capacidad nominal de la línea es de 3.000 L/hora. Producción anual vendible = 3.000 × 8 horas/día × 300 días/año × 95% de rendimiento = 6.840.000 litros/año. Pueden producirse cuellos de botella en la preparación de la fruta, el tiempo de retención del pasteurizador, el suministro de botellas, la velocidad de llenado, el tiempo de actividad de la etiquetadora, el empaque en cajas, el enfriamiento/almacenamiento y la distribución.
19. Cotizaciones de proveedores y ofertas técnicas
No se proporcionó ninguna cotización de proveedor. Las ofertas técnicas finales deben confirmar el tipo de producto, el tamaño de la botella, la temperatura de llenado, el objetivo de pasteurización, el diseño de CIP, las superficies de contacto con el material, la velocidad de salida, la carga de energía/vapor/aire comprimido, las piezas de repuesto, la instalación, la capacitación, la garantía y el Incoterm.
20. Costos de materias primas
Los principales insumos son fruta, pulpa o concentrado, azúcar o edulcorante, ácido cítrico, estabilizadores cuando estén permitidos, agua, botellas, tapas, etiquetas, cajas, film retráctil, productos químicos de limpieza y paletas. El costo variable base es de 0,34 USD/litro, incluyendo ingredientes, empaque, servicios públicos, mano de obra directa y pérdidas normales.

21. Requisitos y gastos operativos
Los gastos operativos fijos anuales se estiman en 420.000 $ en el Año 1 antes de la depreciación, aumentando un 3% anualmente. Esto cubre la gestión, la supervisión de la producción, el control de calidad, el mantenimiento, las ventas/administración, la seguridad, los seguros, el saneamiento, el control de plagas, el marketing básico y los gastos generales.
22. Requisitos de servicios públicos
| Servicio público | Requisito a confirmar | Efecto |
|---|---|---|
| Agua tratada | Agua para producto y agua para lavado/CIP | Requisito fundamental de calidad y seguridad |
| Electricidad | Corriente trifásica para bombas, llenadoras, transportadores y empaque | Controla el tiempo de actividad |
| Vapor/agua caliente | Pasteurización y CIP | Requisito principal del proceso |
| Aire comprimido | Controles de llenado, tapado y empaque | Estabilidad de la línea |
| Agua/refrigeración helada | Enfriamiento del producto cuando sea necesario | Control de vida útil y almacenamiento |
| Tratamiento de aguas residuales | Residuos de frutas, agua azucarada y descarga de limpieza | Requisito reglamentario y de EHS |
23. Estructura organizacional y de gestión
| Rol | Personal | Responsabilidad principal |
|---|---|---|
| Gerente general | 1 | Operaciones, ventas y finanzas |
| Gerente de producción / tecnólogo de alimentos | 1 | Receta, proceso, rendimiento y seguridad alimentaria |
| Supervisores de turno | 2 | Ejecución diaria de la producción |
| Operadores de procesamiento | 6 | Preparación de frutas, mezcla y pasteurización |
| Operadores de llenado/empaque | 12 | Llenado, tapado, etiquetado y empaque |
| Personal de calidad/laboratorio | 3 | Brix, pH, microbiología y controles de liberación |
| Mantenimiento y servicios públicos | 3 | Caldera, bombas, llenadora y servicios públicos |
| Almacén/despacho | 5 | Materias primas, productos terminados y carga |
| Ventas/administración/contabilidad | 5 | Pedidos, facturación y servicio al cliente |
24. Costos de inversión
| Partida de inversión | Estimación | Base |
|---|---|---|
| Línea de procesamiento, mezcla y pasteurización de zumos | $430.000 | Paquete de procesamiento presupuestario |
| Línea de llenado de botellas, taponado, etiquetado y envasado | $360.000 | Asignación para automatización de envasado |
| Tratamiento de agua, CIP, servicios de caldera/enfriador/compresor | $170.000 | Asignación para servicios de grado alimenticio |
| Adecuación de edificio, drenaje, higiene y almacén | $80.000 | Asignación para edificio existente |
| Laboratorio de control de calidad, manipulación, almacenamiento en frío/seco y herramientas de TI | $210.000 | Equipo de soporte |
| Flete, instalación, formación y puesta en marcha | $60.000 | Asignación dependiente del destino |
| Gastos pre-operativos, permisos y lanzamiento | $35.000 | Estimación de planificación |
| Reserva para contingencias | $85.000 | Reserva aproximada |
| Capital de trabajo inicial | $180.000 | Ingredientes, embalaje, inventario y cuentas por cobrar |
| Inversión total del proyecto | $1,43 millones | Subtotal calculado |
25. Requisitos y condiciones de financiación
La financiación base asume un 40% de capital propio y un 60% de deuda. El requisito de capital propio es de 572.000 $ y el requisito de préstamo es de 858.000 $. Las condiciones del préstamo se modelan con un interés anual del 9%, un reembolso de capital igual a cinco años y sin período de gracia. Las condiciones finales dependen del prestamista, la garantía, el riesgo país y el alcance de la inversión confirmado.
26. Previsiones de ingresos y ventas
| Año | Utilización | Volumen de ventas, litros | Ingresos | Beneficio bruto | EBITDA | Beneficio neto | DSCR |
|---|---|---|---|---|---|---|---|
| A1 | 50,0% | 3.420.000 | $1,88 millones | $718.200 | $298.200 | $76.784 | 1,12x |
| A2 | 65,0% | 4.446.000 | $2,45 millones | $933.660 | $501.060 | $251.427 | 1,88x |
| A3 | 75,0% | 5.130.000 | $2,82 millones | $1,08 millones | $631.722 | $368.312 | 2,48x |
| A4 | 85,0% | 5.814.000 | $3,20 millones | $1,22 millones | $761.995 | $484.885 | 3,16x |
| A5 | 90,0% | 6.156.000 | $3,39 millones | $1,29 millones | $820.046 | $543.682 | 3,66x |
| Escenario | Supuestos clave | Ventas del A5 | Ingresos del A5 | Interpretación |
|---|---|---|---|---|
| Conservador | 70% de utilización; precio -6%; ingredientes +5% | 4,79 millones L | $2,48 millones | Marginal; requiere disciplina en costos y ruta |
| Caso base | 90% de utilización; precio de 0,55 USD/L | 6.156.000 L | $3,39 millones | Positivo bajo los supuestos |
| Optimista | 95% de utilización; mezcla de SKU premium y embalaje estable | 6,50 millones L | $3,75 millones | Fuerte si se aseguran los distribuidores |
27. Estados financieros
| Año | Utilización | Volumen de ventas | Ingresos | Beneficio bruto | EBITDA | Beneficio neto | DSCR |
|---|---|---|---|---|---|---|---|
| A1 | 50,0% | 3.420.000 | $1,88 millones | $718.200 | $298.200 | $76.784 | 1,12x |
| A2 | 65,0% | 4.446.000 | $2,45 millones | $933.660 | $501.060 | $251.427 | 1,88x |
| A3 | 75,0% | 5.130.000 | $2,82 millones | $1,08 millones | $631.722 | $368.312 | 2,48x |
| A4 | 85,0% | 5.814.000 | $3,20 millones | $1,22 millones | $761.995 | $484.885 | 3,16x |
| A5 | 90,0% | 6.156.000 | $3,39 millones | $1,29 millones | $820.046 | $543.682 | 3,66x |
| Año | Flujo de efectivo operativo | Amortización de capital de deuda | Flujo de efectivo apalancado | Flujo de efectivo acumulado de capital | Deuda de cierre |
|---|---|---|---|---|---|
| A1 | $201.784 | $171.600 | $30.184 | $-541.816 | $686.400 |
| A2 | $376.427 | $171.600 | $204.827 | $-336.989 | $514.800 |
| A3 | $493.312 | $171.600 | $321.712 | $-15.277 | $343.200 |
| A4 | $609.885 | $171.600 | $438.285 | $423.009 | $171.600 |
| A5 | $668.682 | $171.600 | $497.082 | $920.090 | $0 |
| Año | Activos fijos netos | Inventario | Cuentas por cobrar | Efectivo | Activos totales | Cuentas por pagar | Saldo del préstamo | Capital + ganancias retenidas | Pasivos + patrimonio |
|---|---|---|---|---|---|---|---|---|---|
| A1 | $1,12 millones | $79.644 | $180.370 | $13.885 | $1,40 millones | $63.715 | $686.400 | $648.784 | $1,40 millones |
| A2 | $1,00 millones | $103.537 | $234.481 | $159.823 | $1,50 millones | $82.830 | $514.800 | $900.211 | $1,50 millones |
| A3 | $875.000 | $119.466 | $270.555 | $442.275 | $1,71 millones | $95.573 | $343.200 | $1,27 millones | $1,71 millones |
| A4 | $750.000 | $135.395 | $306.629 | $841.301 | $2,03 millones | $108.316 | $171.600 | $1,75 millones | $2,03 millones |
| A5 | $625.000 | $143.359 | $324.666 | $1,32 millones | $2,41 millones | $114.687 | $0 | $2,30 millones | $2,41 millones |
28. Indicadores y análisis financieros
| Indicador | Fórmula / base | Resultado base | Interpretación |
|---|---|---|---|
| Margen bruto | Ingresos menos costo de bienes vendidos dividido por ingresos | 38,2% | Positivo si se controlan los ingredientes y el embalaje |
| Margen de contribución | Precio de venta menos costo variable | 0,21 USD/litro | Utilizado para el punto de equilibrio |
| Cantidad de equilibrio | Costo fijo + depreciación dividido por contribución | 2.595.238 litros/año | Requiere 37,9% de utilización |
| ROI | Beneficio neto promedio dividido por la inversión | 24,1% | Positivo después de la puesta en marcha |
| VPN | Flujo de efectivo no apalancado descontado al 12% | $312.053 | Positivo pero sensible al precio y a los ingredientes |
| TIR | Tasa de descuento en la que el VPN es igual a cero | 19,2% | Superior a la tasa de obstáculo del 12% |
| Plazo de recuperación | Recuperación acumulada del flujo de efectivo de capital apalancado | Durante el Año 4 | Depende del crecimiento del distribuidor | Deuda a capital | Deuda dividida por capital | 1,50x | Apalancamiento moderado |
| Requisito de efectivo mínimo | Capital de trabajo inicial | 180.000 $ | Necesario para ingredientes, envases y cuentas por cobrar |
29. Análisis de punto de equilibrio
Contribución por litro = 0,55 − 0,34 = 0,21 USD/litro. Cantidad de equilibrio = costo fijo más depreciación (545.000 $) ÷ contribución = 2.595.238 litros/año. Ingresos de equilibrio = 1,43 millones de $ y utilización de equilibrio = 37,9% de la capacidad anual de venta.
Fuente: modelo de caso base calculado, 2026. Unidad: porcentaje de la capacidad anual de venta.
30. Análisis de sensibilidad
| Variable probada | Impacto del VAN | Criticidad |
|---|---|---|
| Precio de venta -10% | -455.000 $ | Alta |
| Costo de la fruta/concentrado +10% | -310.000 $ | Alta |
| Utilización de ventas -10% | -230.000 $ | Alta |
| Costo de embalaje +10% | -115.000 $ | Media |
| Azúcar/aditivos +10% | -42.000 $ | Media |
| Mano de obra +10% | -52.000 $ | Media |
| Costo de capital +10% | -143.000 $ | Media |
| Retraso de lanzamiento 6 meses | -175.000 $ | Alta |
| Precio de venta +10% | 455.000 $ | Alta |
Fuente: modelo de sensibilidad calculado, 2026. Unidad: impacto en USD en el VAN.
Clasificación de variables críticas: el precio de venta, el costo de la fruta/concentrado, la utilización de ventas, el retraso en el lanzamiento y el costo de envasado son los principales impulsores de la viabilidad.
31. Requisitos legales y reglamentarios
Los requisitos normalmente incluyen registro de la empresa, licencia de procesamiento de alimentos, aprobación de etiquetado de productos, plan de seguridad alimentaria, controles tipo HACCP, aprobación de calidad del agua, registro de impuestos, seguridad contra incendios, normas de salud de los trabajadores, aprobación ambiental y cumplimiento de vehículos de reparto. Las normas HACCP para jugos de la FDA y las normas Codex para jugos de frutas proporcionan un contexto de referencia, pero la legislación local controla los requisitos finales [4][5].
32. Análisis de medio ambiente, salud y seguridad

Los problemas de EHS incluyen agua/vapor caliente, quemaduras por pasteurizador, manipulación de botellas, CIP químico, suelos mojados, residuos de fruta, aguas residuales, cintas transportadoras en movimiento, aire comprimido, carretillas elevadoras, control de plagas y peligros microbiológicos. El proyecto debe implementar controles tipo HACCP, SOP de saneamiento, trazabilidad, gestión de alérgenos/ingredientes y gestión de aguas residuales.
33. Análisis y registro de riesgos
| Riesgo | Probabilidad | Impacto | Mitigación |
|---|---|---|---|
| Aumento del precio de la fruta o del concentrado | Alta | Alto | Contratos con proveedores y revisión de costos de recetas |
| Escasez de envases | Media | Alto | Múltiples proveedores de botellas, tapas, etiquetas y cartones |
| Problema de seguridad alimentaria o vida útil | Baja-media | Alto | HACCP, validación de pasteurización y controles de laboratorio |
| Lenta adopción por parte del distribuidor | Media | Alto | Muestreo, plan de margen y acuerdos de ruta |
| Altas devoluciones/existencias caducadas | Media | Medio-alto | Previsión de la demanda y rotación de la vida útil |
| Interrupción del suministro de servicios públicos o de la calidad del agua | Media | Alto | Tratamiento del agua, energía de respaldo y mantenimiento |
| Retraso en las cuentas por cobrar | Media | Media | Límites de crédito, depósitos y controles de cobro |
34. Calendario de implementación
| Fase | Duración | Tareas clave |
|---|---|---|
| Localización de la viabilidad | 2-4 semanas | Datos del país, recetas, precios de ingredientes y entrevistas con distribuidores |
| Ingeniería, permisos y presupuestos | 1-2 meses | Diseño, licencia de alimentos, servicios públicos y ofertas de proveedores |
| Adquisiciones y fabricación | 2-3 meses | Máquinas, llenadora, herramientas de envasado y envío |
| Obras civiles y servicios públicos | 2-3 meses | Drenaje, tratamiento de agua, vapor/agua caliente, energía y trabajos de higiene |
| Instalación y puesta en marcha | 4-6 semanas | Instalación de máquinas, CIP, pasteurización y producción de prueba |
| Lanzamiento comercial | 1 mes | Muestreo, incorporación de rutas y primeros pedidos |
Fuente: supuesto de planificación de implementación, 2026. Unidad: meses.
Gráficos basados en datos
Fuente: modelo de caso base calculado, 2026. Unidad: millones de USD.
Fuente: modelo de caso base calculado, 2026. Unidad: miles de USD.
Fuente: supuesto de aumento, 2026. Unidad: porcentaje.
Fuente: modelo de inversión, 2026. Unidad: USD.
Fuente: supuesto de estructura de costos, 2026. Unidad: participación del costo variable.
Fuente: calendario de deuda, 2026. Unidad: miles de USD.
35. Fuentes y supuestos
Registro de supuestos
| Supuesto | Valor | Base | Confianza | Efecto |
|---|---|---|---|---|
| Moneda | USD | Supuesto del analista | Media | Todos los resultados |
| Capacidad | 3.000 L/hora × 8 h/día × 300 días × 95% = 6.840.000 L/año | Supuesto de planificación calculado | Media | Ingresos |
| Precio de venta | 0,55 USD/L | Supuesto de planificación mixto ex fábrica | Baja-media | Ingresos y margen |
| Costo variable | 0,34 USD/L | Ingredientes, envases, servicios públicos, mano de obra y pérdidas | Media | Margen bruto |
| Inversión total | 1,43 millones de $ | Presupuesto de maquinaria y asignación de fábrica | Media | VAN y financiación |
| Financiación | 40% capital, 60% deuda, 9%, cinco años | Supuesto del analista | Baja-media | Flujo de caja |
| Impuestos y descuentos | 20% impuestos, 12% descuentos | Supuesto de planificación | Baja-media | VAN y beneficio neto |
Registro de fuentes
| Ref | Organización | Fuente y URL | Datos utilizados | Fecha de acceso | Confianza |
|---|---|---|---|---|---|
| [1] | Banco Mundial | Indicadores de Desarrollo Mundial: Manufactura, valor agregado, https://api.worldbank.org/v2/indicator/NV.IND.MANF.CD | Fuente de contexto de manufactura | 6 de agosto de 2026 | Alta |
| [2] | Banco Mundial | Indicadores de Desarrollo Mundial: Población total, https://api.worldbank.org/v2/indicator/SP.POP.TOTL | Contexto de localización de la demanda | 6 de agosto de 2026 | Alta |
| [3] | FAO | Plataforma FAOSTAT de cultivos, https://www.fao.org/faostat/en/#data/QCL | Fuente de localización de suministro de frutas y cultivos | 6 de agosto de 2026 | Alta para el contexto agrícola oficial |
| [4] | Codex Alimentarius | Norma General para Zumos y Néctares de Frutas CXS 247-2005, https://www.fao.org/fao-who-codexalimentarius | Contexto de la norma de zumos y néctares de frutas | 6 de agosto de 2026 | Alta |
| [5] | FDA | HACCP para zumos, https://www.fda.gov/food/hazard-analysis-critical-control-point-haccp/juice-haccp | Contexto de seguridad/HACCP para zumos | 6 de agosto de 2026 | Alta para el contexto de EE. UU. |
| [6] | USITC / HTS | Capítulo 20 preparaciones de verduras, frutas y frutos secos, https://hts.usitc.gov/reststop/file?release=currentRelease&filename=Chapter%2020 | Advertencia sobre la clasificación de zumos HS 2009 | 6 de agosto de 2026 | Alta para referencia HS |
| [7] | OMS | Dieta saludable, https://www.who.int/news-room/fact-sheets/detail/healthy-diet | Contexto de azúcar y dieta para el posicionamiento de bebidas | 6 de agosto de 2026 | Alta |
36. Sección de consulta
¿Necesita un estudio localizado de una fábrica de producción de zumos?
Para un informe bancario de una fábrica de producción de zumos, confirme el país, la ciudad, las recetas de productos, los precios de la fruta o el concentrado, los tamaños de las botellas, el formato del envase, la tarifa de servicios públicos, el estado del edificio, los contratos con distribuidores, la tasa impositiva, los términos de financiación y los presupuestos de los proveedores. Rolangear puede apoyar la configuración de la línea de procesamiento de zumos, la selección de maquinaria, la planificación de la capacidad y la comparación de presupuestos.
Contactar con Rolangear37. Conclusión final y recomendación
La fábrica de producción de zumos es técnicamente viable y financieramente positiva bajo los supuestos presupuestarios establecidos. La inversión es más atractiva cuando la planta asegura un suministro estable de ingredientes y envases, valida la vida útil, desarrolla canales minoristas y HORECA, controla las devoluciones y mantiene la disciplina de seguridad alimentaria. La recomendación es proceder a la validación localizada antes de la inversión final: confirmar la demanda, las recetas, los precios de venta, los costos de ingredientes y envases, la idoneidad del edificio, las regulaciones alimentarias y las cotizaciones formales de los proveedores.