Estudio de viabilidad de una fábrica de botellas de PET
Estudio de viabilidad para una fábrica de botellas de PET
Estudio de viabilidad profesional para una fábrica de botellas de PET de tamaño pequeño a mediano que produce botellas de agua, botellas de bebidas, botellas de aceite comestible, botellas de detergente y envases de PET de marca privada. Debido a que no se suministró información sobre el país, la ciudad, el precio de la resina, la tarifa de servicios públicos, las condiciones del edificio ni las cotizaciones de los proveedores, este informe utiliza supuestos de planificación transparentes en USD que deben localizarse antes de la aprobación de la inversión.
Mapa del estudio
1. Resumen ejecutivo
El proyecto es una fábrica de botellas de PET que produce botellas de agua, botellas de bebidas, botellas de aceite comestible, botellas de detergente y formatos de botellas de marca privada. El caso base asume una configuración integrada de inyección de preformas y moldeo por estirado-soplado con una producción anual vendible de aproximadamente 2,250 toneladas de botellas de PET terminadas, equivalente a unos 90 millones de botellas de 25 g/año antes del ajuste de la mezcla de productos.\

Con un precio de venta promedio en fábrica de 2,700 USD/tonelada, un costo variable de 1,900 USD/tonelada y una inversión total de 2.10 millones de dólares, los ingresos del año 5 alcanzan los 5.47 millones de dólares y la utilidad neta del año 5 alcanza los 697,661 dólares. El VPN base es de 244,350 dólares con una tasa de descuento del 12%, la TIR estimada es del 16.0% y la utilización de equilibrio es del 36.9%.
2. Alcance y metodología del estudio
Este estudio cubre el mercado, aspectos técnicos, operativos, de personal, inversión, financiación, ingresos, estados financieros, indicadores, punto de equilibrio, sensibilidad, aspectos legales, EHS, riesgos, implementación, fuentes, consultoría y recomendación final. Los indicadores del Banco Mundial apoyan el contexto macro y de localización de la demanda [1][2]. El Capítulo 39 del SA apoya las advertencias sobre la clasificación de los envases de plástico [3]. Las referencias de la EFSA/FDA, OSHA, PNUMA y la UE sobre envases apoyan el contexto de contacto con alimentos, seguridad y medio ambiente [4][5][6][7][8].
3. Concepto y naturaleza del proyecto
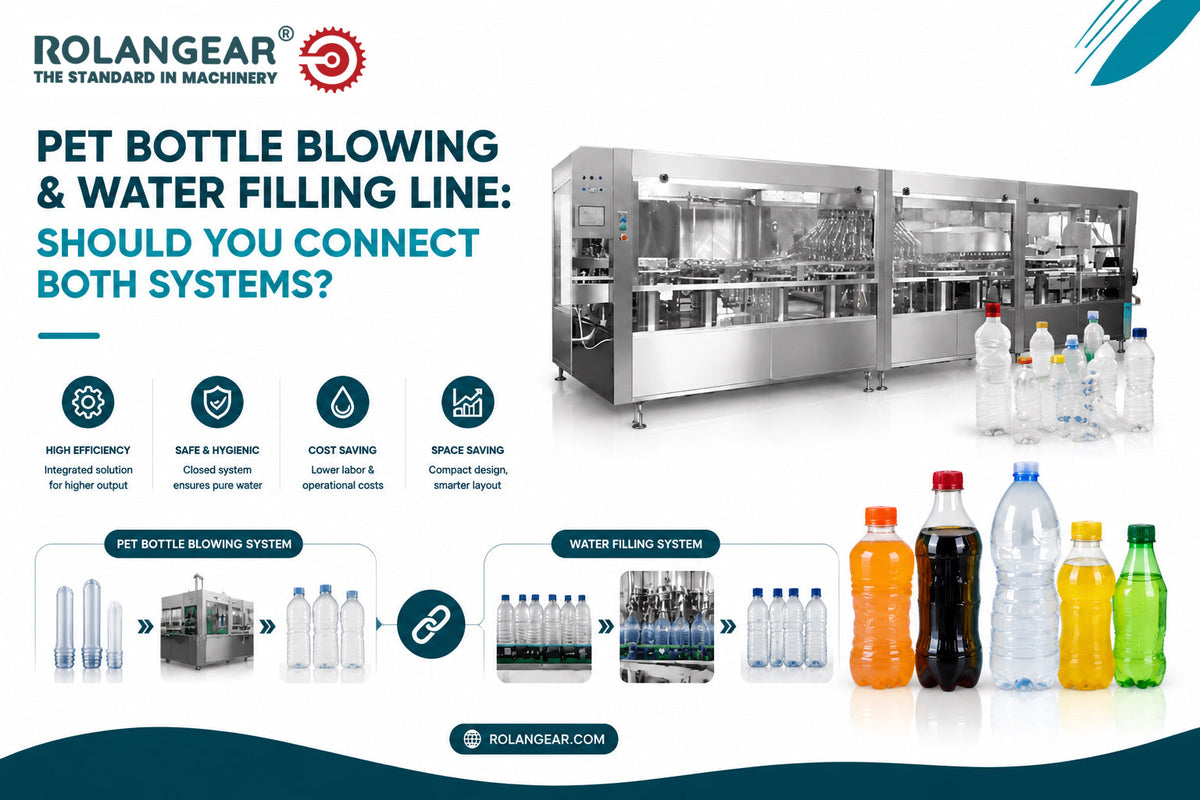
El proyecto es una planta industrial de envases de plástico. La resina de PET se seca y se moldea por inyección en preformas, o se compran preformas y se soplan directamente; las preformas se recalientan y se estiran-soplan para convertirlas en botellas terminadas, se inspeccionan, se empaquetan y se envían. El modelo de negocio combina el suministro local a plantas embotelladoras de agua, productores de bebidas, envasadores de aceite comestible, procesadores de alimentos, cosméticos, rellenadores de detergente y compradores de envases de marca privada.

4. Análisis del producto y tabla de especificaciones del producto
Las especificaciones del producto incluyen el acabado del cuello, el volumen de la botella, el peso, la distribución de la pared, la resistencia a la carga superior, la claridad, el color, las necesidades de barrera de oxígeno/luz, la compatibilidad de la tapa, el panel de etiquetas, el embalaje en cartón o bolsa y la idoneidad para el contacto con alimentos. No debe reclamarse el cumplimiento hasta que se verifiquen la resina, los aditivos, la higiene del proceso y las regulaciones locales.
| Producto | Especificación típica | Cliente objetivo | Notas de calidad |
|---|---|---|---|
| Botellas de agua | 250 ml a 1.5 L, peso ligero a medio | Embotelladores y distribuidores de agua | Claridad, carga superior, acabado del cuello, rendimiento de fugas |
| Botellas de bebidas | Formatos carbonatados o no carbonatados según lo especificado | Llenadoras de zumos y bebidas | Distribución de la pared y compatibilidad con la línea de llenado |
| Botellas de aceite comestible | 500 ml a 5 L, pared más gruesa | Envasadores de aceite y procesadores de alimentos | Resistencia del asa, sellado de la tapa y resistencia a caídas |
| Botellas de detergente/cosméticos | Formas coloreadas o personalizadas | Marcas de productos químicos para el hogar y cuidado personal | Debe comprobarse la compatibilidad química |
| Botellas de marca privada | Moldes y cuellos específicos del cliente | Propietarios de marcas y envasadores por contrato | Propiedad del molde, diseño y aprobación de control de calidad |
5. Indicadores económicos y ubicación del proyecto
La demanda de botellas de PET está ligada al agua embotellada, bebidas, aceite comestible, lácteos/zumos, productos químicos domésticos, cosméticos, crecimiento demográfico y sustitución de envases. Los indicadores de población y manufactura del Banco Mundial deben usarse cuando se localice el estudio [1][2]. La ubicación debe priorizar el acceso a resina o preformas de PET, clientes de llenado de bebidas/alimentos, electricidad confiable, aire comprimido, agua de enfriamiento, zonificación industrial y rutas logísticas.
| Factor | Ponderación | Condición preferida | Efecto |
|---|---|---|---|
| Proximidad al cliente | 23% | Cerca de embotelladoras de agua, bebidas, aceite y FMCG | Mejora el costo y el servicio de entrega |
| Logística de resina/preforma de PET | 20% | Cerca de distribuidores de resina, rutas de importación o suministro petroquímico | Controla el capital de trabajo y el costo de la resina |
| Energía y servicios públicos | 18% | Energía trifásica confiable, capacidad de compresor y enfriador | Protege la producción y la calidad |
| Zonificación industrial y permisos | 14% | Zona de plásticos/envases aprobada | Reduce el retraso en el inicio |
| Mano de obra técnica | 10% | Habilidades de inyección, soplado y mantenimiento | Apoya el tiempo de actividad |
| Ecosistema de reciclaje | 8% | Compradores de chatarra o ruta de trituración/reciclaje | Mejora el manejo de residuos |
| Espacio de expansión | 7% | Espacio para moldes, almacenamiento de preformas y segunda línea | Apoya el volumen futuro |
6. Indicadores del mercado objetivo con separación del mercado TAM, SAM y mercado obtenible de forma realista
| Capa | Definición | Tratamiento de planificación |
|---|---|---|
| TAM | Toda la demanda de botellas de PET para agua, bebidas, aceites, alimentos, cosméticos y productos químicos | No está totalmente disponible para una sola fábrica |
| SAM | Demanda alcanzable a través de clientes y distribuidores de llenado planificados | Validar mediante entrevistas a compradores y aprobaciones de muestras |
| Mercado obtenible de forma realista | Volumen que una nueva fábrica puede ganar en cinco años | Limitado por moldes, precio, calidad y contratos de entrega |
| Previsión de ventas del proyecto | Aumento hasta 2,025 t/año para el Año 5 | Previsión basada en la capacidad, no una reclamación de cuota de mercado |
7. Análisis de la demanda
Dado que no se proporcionó ningún país, este informe utiliza una previsión basada en la capacidad. Lógica de capacidad: producción promedio de planificación de 2,250 toneladas/año de botellas vendibles. Con un peso promedio de botella de 25 g, esto equivale a aproximadamente 90 millones de botellas/año antes del ajuste de la mezcla. Las ventas del año 1 son de 1,125 toneladas y las ventas del año 5 son de 2,025 toneladas. La demanda local debería calcularse posteriormente a partir de los llenadores objetivo × consumo anual de botellas, más el consumo aparente y las comprobaciones de importación/exportación.
8. Análisis de producción local
El análisis de la producción local debe identificar a los productores integrados de preformas y botellas de PET, a los sopladores de botellas cercanos a las plantas de agua, a las líneas de botellas internas de las empresas de bebidas, a los proveedores de preformas importadas, a los fabricantes de botellas de PET reciclado y a los talleres de moldes. No se indica la producción local exacta porque no se proporcionó ningún país; debe verificarse a través de registros industriales, entrevistas con distribuidores y muestreo de compradores.

9. Análisis de importación y exportación con salvedades del código SA
Las clasificaciones probables se encuentran en el Capítulo 39 del SA para plásticos y sus manufacturas. Las botellas de PET y recipientes similares a menudo se revisan bajo el SA 3923 para manufacturas de plástico para el transporte o embalaje de mercancías, mientras que las preformas pueden requerir una revisión de la subpartida nacional por separado [3]. El SA 3923 es amplio y puede incluir muchos artículos de embalaje de plástico, por lo que los datos comerciales no deben tratarse como una demanda exacta de botellas de PET sin la validación de la subpartida nacional.
10. Análisis de la competencia
| Tipo de competidor | Ejemplos para investigar localmente | Presión | Respuesta |
|---|---|---|---|
| Plantas integradas de preformas/botellas | Grupos de embalaje que prestan servicio a empresas de bebidas | Alta | Competir con flexibilidad de moldes y fiabilidad de entrega |
| Soplado de botellas interno | Productores de agua y bebidas con sopladoras propias | Media-alta | Suministrar capacidad de respaldo y moldes personalizados |
| Preformas/botellas importadas | Comerciantes regionales y convertidores de resina | Media | Ofrecer plazos de entrega locales y servicio técnico |
| Pequeños talleres de moldeo por soplado | Productores locales de botellas personalizadas | Media | Mejorar la consistencia, el control de calidad y la disciplina de contacto con alimentos |
| Sustitutos | Botellas de HDPE, vidrio, cartones, latas | Media por categoría de producto | Centrarse donde el PET tiene ventajas de peso y claridad |
11. Análisis de brechas de mercado
La brecha de mercado debe ser igual a la demanda estimada de botellas menos la oferta local confiable, ajustada por importaciones, exportaciones, capacidad cautiva propiedad del comprador y envases sustitutos. En este modelo preliminar, la fábrica necesita vender 2,025 toneladas para el año 5. Esto debe estar respaldado por compromisos de clientes de líneas de llenado, dibujos de botellas, aprobaciones de muestras y planes de moldes antes de la aprobación final.
12. Análisis DAFO
| Fortalezas | Debilidades | Oportunidades | Amenazas |
|---|---|---|---|
| Amplia demanda de envases de agua, bebidas y FMCG | Requiere un fuerte control técnico y moldes | Programas de marca privada y botellas personalizadas | Precio de la resina PET y volatilidad monetaria |
| Posibles clientes de alto volumen y repetición | La aprobación del cliente puede llevar tiempo | Sustitución de importaciones y entrega local rápida | Fuertes proveedores de envases existentes |
| Escalable con moldes y sopladoras adicionales | Se requiere disciplina de calidad para el contacto con alimentos | Los servicios de aligeramiento añaden valor | Impuestos sobre el plástico, normas de reciclaje y obligaciones de EPR |
13. Plan de marketing y promoción

El plan de marketing debe dirigirse a embotelladores de agua, plantas de zumos, envasadores de aceite comestible, marcas de detergentes/cosméticos, envasadores por contrato y distribuidores de envases. Las acciones de lanzamiento incluyen muestras de botellas, paquetes de cotización de moldes, comprobaciones de compatibilidad con la línea de llenado, pruebas de carga superior/fugas, ofertas de programas de entrega y cláusulas de ajuste de precios vinculadas al costo de la resina.
14. Plan de precios
| Producto | Precio de venta planificado | Lógica de precios |
|---|---|---|
| Botellas de agua | USD 2,300–2,900/t | Formato de producto básico ligero con alto volumen |
| Botellas de bebidas | USD 2,600–3,400/t | La forma, el cuello, la barrera y la compatibilidad de llenado afectan el precio |
| Botellas de aceite comestible | USD 2,700–3,600/t | La pared más gruesa y la resistencia del asa respaldan el precio |
| Botellas de detergente/cosméticos | USD 2,800–4,000/t | La forma y el color personalizados añaden valor |
| Precio del modelo combinado | USD 2,700/t | Utilizado para el modelo financiero base |
15. Plan de distribución
La distribución debe priorizar el suministro directo a plantas de envasado y propietarios de marcas, respaldado por entregas programadas y stock de reserva para SKUs de alto volumen. Las botellas personalizadas requieren normas de propiedad del molde, cantidades mínimas de pedido, aprobación de muestras y control documentado de las especificaciones. Las botellas estándar pueden venderse a través de distribuidores de envases donde los márgenes lo permitan.
16. Maquinaria, equipos y costos de la línea de producción

Los costes de la maquinaria son estimaciones de planificación presupuestaria, no cotizaciones de proveedores. Los costes finales dependen del número de cavidades, el peso de la preforma, el tamaño de la botella, los juegos de moldes, las especificaciones del enfriador y del compresor, el nivel de automatización, el secado de la resina, la inspección, el embalaje y el destino.
| Máquina/equipo | Función | Estimación presupuestaria |
|---|---|---|
| Secador y deshumidificador de resina PET | Prepara la resina PET para el moldeo por inyección | 60.000-150.000 USD |
| Máquina de moldeo por inyección de preformas y moldes | Produce preformas de PET | 450.000-900.000 USD |
| Máquina de moldeo por soplado-estirado | Sopla preformas calentadas para convertirlas en botellas | 250.000-650.000 USD |
| Moldes de botellas y preformas | Define el cuello, el volumen, la forma y el peso | 80.000-250.000 USD |
| Compresor de aire y sistema de alta presión | Suministra aire de soplado | 120.000-300.000 USD |
| Enfriador, torre de refrigeración y sistema de agua | Controla las temperaturas del molde y del proceso | 80.000-180.000 USD |
| Herramientas de inspección, embalaje y manipulación | Calidad, embalaje y soporte de almacén | 60.000-160.000 USD |
17. Costes de construcción, instalaciones y edificación
La instalación debe incluir almacenamiento de resina, área de secado/inyección, almacenamiento de preformas, sala de moldeo por soplado, sala de aire comprimido, área de enfriadores, almacenamiento de moldes, laboratorio de control de calidad, zona de embalaje, almacén de productos terminados, taller de mantenimiento, oficina y muelle de carga. El modelo base asume un edificio existente que requiere acondicionamiento en lugar de la compra de terreno.
18. Capacidad de producción e idoneidad de la línea
La capacidad de venta se modela en 2.250 toneladas/año. Con una botella promedio de 25 g, esto equivale aproximadamente a 90 millones de botellas/año. La capacidad real cambia con el peso de la botella, el número de cavidades, el tiempo de ciclo, la disponibilidad de preformas, la velocidad de moldeo por soplado, los cambios de molde, la capacidad del compresor y la velocidad de embalaje. Los cuellos de botella suelen producirse en el secado de la resina, el tiempo de ciclo de inyección, el suministro de aire de alta presión, la capacidad del enfriador y el cambio de molde.

19. Cotizaciones de proveedores y ofertas técnicas
No se proporcionó ninguna cotización de proveedor. Las ofertas técnicas finales deben confirmar el rango IV de la resina PET, el peso de la preforma, el acabado del cuello, el número de cavidades, el tonelaje de inyección, el tiempo de ciclo, el volumen de la botella, la producción por tamaño de botella, el material del molde, la demanda de aire de alta presión, la carga del enfriador, las piezas de repuesto, la garantía, la instalación, la formación y el Incoterm.
20. Costes de materia prima
Los principales insumos son resina PET o preformas compradas, masterbatch de color, tapas cuando se suministran, etiquetas cuando se incluyen, cartones o película retráctil, palés y consumibles de control de calidad. El coste variable base es de 1.900 USD/tonelada de botellas terminadas, incluyendo PET, embalaje directo, servicios públicos, mano de obra directa y residuos normales. El coste de la resina/preforma de PET es el mayor factor de margen.
21. Requisitos y gastos de explotación
Los gastos de explotación fijos anuales se estiman en 480.000 USD en el Año 1 antes de la depreciación, aumentando un 3% anualmente. Esto cubre la gestión, supervisores, control de calidad, mantenimiento, cuidado de moldes, ventas/administración, seguros, seguridad, limpieza, marketing básico y gastos generales.
22. Requisitos de servicios públicos
| Servicio público | Requisito a confirmar | Efecto |
|---|---|---|
| Electricidad | Energía trifásica para inyección, secado, moldeo por soplado y transportadores | Principal impulsor de costes y tiempo de actividad |
| Aire comprimido de alta presión | Sistema de aire para moldeo por soplado-estirado | Cuello de botella crítico para la producción de botellas |
| Agua fría | Moldes de inyección, moldes de soplado y refrigeración de procesos | Controla la calidad y el tiempo de ciclo |
| Secado/deshumidificación | Control de humedad del PET antes de la inyección | Previene defectos y debilidad |
| Ventilación | Extracción de calor alrededor de las máquinas y compresores | Estabilidad de la mano de obra y de la máquina |
| Gestión de incendios y residuos | Almacenamiento de PET, rechazos y control de residuos de embalaje | EHS y cumplimiento |
23. Estructura organizativa y de gestión
| Función | Número de empleados | Principal responsabilidad |
|---|---|---|
| Gerente general | 1 | Operaciones, ventas y finanzas |
| Supervisores de producción | 2 | Producción por turno y coordinación de línea |
| Operadores de inyección | 4 | Secado, inyección de preformas y controles de proceso |
| Operadores de moldeo por soplado | 6 | Soplado de botellas, cambios de molde y flujo de embalaje |
| Técnicos de control de calidad | 2 | Peso, dimensiones, carga superior, fugas y controles visuales |
| Técnicos de mantenimiento/moldes | 4 | Mantenimiento mecánico, eléctrico, de aire, enfriadores y moldes |
| Almacén/expedición | 4 | Resina, preformas, botellas y carga |
| Ventas/administración/contabilidad | 4 | Pedidos, facturación, crédito y servicio al cliente |
24. Costes de inversión
| Partida de inversión | Estimación | Base |
|---|---|---|
| Sistema de inyección de preformas, secador y moldes | 760.000 $ | Paquete de equipos presupuestario |
| Línea de moldeo por soplado-estirado y moldes de botellas | 520.000 $ | Paquete de producción de botellas |
| Compresor de alta presión, enfriador y servicios públicos | 230.000 $ | Asignación de servicios públicos |
| Acondicionamiento de edificio, energía y configuración de almacén | 100.000 $ | Asignación de edificio existente |
| Control de calidad, taller de moldes, manipulación y herramientas informáticas | 190.000 $ | Equipo de soporte |
| Flete, instalación, formación y puesta en marcha | 90.000 $ | Asignación dependiente del destino |
| Gastos preoperativos, permisos y lanzamiento | 45.000 $ | Estimación de planificación |
| Reserva para contingencias | 115.000 $ | Reserva aproximada |
| Capital de trabajo inicial | 250.000 $ | Resina/preformas de PET, embalaje y cuentas por cobrar |
| Inversión total del proyecto | 2,10 millones de $ | Subtotal calculado |
25. Requisitos y condiciones de financiación

La financiación base asume un 40% de capital propio y un 60% de deuda. El requisito de capital propio es de 840.000 USD y el requisito de préstamo es de 1,26 millones de USD. Las condiciones del préstamo se modelan con un interés anual del 9%, un reembolso de capital a cinco años en cuotas iguales y sin período de gracia. Las condiciones finales dependen del prestamista, la garantía, el riesgo del país y el alcance de la inversión confirmada.
26. Previsiones de ingresos y ventas
| Año | Utilización | Volumen de ventas, toneladas | Ingresos | Beneficio bruto | EBITDA | Beneficio neto | DSCR |
|---|---|---|---|---|---|---|---|
| A1 | 50.0% | 1.125 | 3,04 millones de $ | 900.000 $ | 420.000 $ | 97.280 $ | 1.08x |
| A2 | 65.0% | 1.462 | 3,95 millones de $ | 1,17 millones de $ | 675.600 $ | 319.904 $ | 1.74x |
| A3 | 75.0% | 1.688 | 4,56 millones de $ | 1,35 millones de $ | 840.768 $ | 470.182 $ | 2.26x |
| A4 | 85.0% | 1.912 | 5,16 millones de $ | 1,53 millones de $ | 1,01 millones de $ | 620.105 $ | 2.86x |
| A5 | 90.0% | 2.025 | 5,47 millones de $ | 1,62 millones de $ | 1,08 millones de $ | 697.661 $ | 3.30x |
| Escenario | Supuestos clave | Ventas del A5 | Ingresos del A5 | Interpretación |
|---|---|---|---|---|
| Conservador | 70% de utilización; precio -6%; resina +5% | 1.575 t/a | 4,00 millones de $ | Marginal; requiere contratos y control de costes |
| Caso base | 90% de utilización; precio 2.700 USD/t | 2.025 t/a | 5,47 millones de $ | Positivo bajo los supuestos |
| Optimista | 95% de utilización; precio +5%; peso de la botella optimizado | 2.138 t/a | 6,06 millones de $ | Fuerte si se aseguran clientes ancla |
27. Estados financieros
| Año | Utilización | Volumen de ventas | Ingresos | Beneficio bruto | EBITDA | Beneficio neto | DSCR |
|---|---|---|---|---|---|---|---|
| A1 | 50.0% | 1.125 | 3,04 millones de $ | 900.000 $ | 420.000 $ | 97.280 $ | 1.08x |
| A2 | 65.0% | 1.462 | 3,95 millones de $ | 1,17 millones de $ | 675.600 $ | 319.904 $ | 1.74x |
| A3 | 75.0% | 1.688 | 4,56 millones de $ | 1,35 millones de $ | 840.768 $ | 470.182 $ | 2.26x |
| A4 | 85.0% | 1.912 | 5,16 millones de $ | 1,53 millones de $ | 1,01 millones de $ | 620.105 $ | 2.86x |
| A5 | 90.0% | 2.025 | 5,47 millones de $ | 1,62 millones de $ | 1,08 millones de $ | 697.661 $ | 3.30x |
| Año | Flujo de efectivo operativo | Amortización de deuda | Flujo de efectivo apalancado | Flujo de efectivo acumulado de capital | Deuda final |
|---|---|---|---|---|---|
| A1 | 282.280 $ | 252.000 $ | 30.280 $ | -809.720 $ | 1,01 millones de $ |
| A2 | 504.904 $ | 252.000 $ | 252.904 $ | -556.816 $ | 756.000 $ |
| A3 | 655.182 $ | 252.000 $ | 403.182 $ | -153.634 $ | 504.000 $ |
| A4 | 805.105 $ | 252.000 $ | 553.105 $ | 399.471 $ | 252.000 $ |
| A5 | 882.661 $ | 252.000 $ | 630.661 $ | 1,03 millones de $ | 0 $ |
| Año | Activos fijos netos | Inventario | Cuentas por cobrar | Efectivo | Total de activos | Cuentas por pagar | Saldo del préstamo | Patrimonio + ganancias retenidas | Pasivos + patrimonio |
|---|---|---|---|---|---|---|---|---|---|
| A1 | 1,67 millones de $ | 175.685 $ | 332.877 $ | -81.878 $ | 2,09 millones de $ | 146.404 $ | 1,01 millones de $ | 937.280 $ | 2,09 millones de $ |
| A2 | 1,48 millones de $ | 228.390 $ | 432.740 $ | 62.379 $ | 2,20 millones de $ | 190.325 $ | 756.000 $ | 1,26 millones de $ | 2,20 millones de $ |
| A3 | 1,29 millones de $ | 263.527 $ | 499.315 $ | 393.130 $ | 2,45 millones de $ | 219.606 $ | 504.000 $ | 1,73 millones de $ | 2,45 millones de $ |
| A4 | 1,11 millones de $ | 298.664 $ | 565.890 $ | 873.803 $ | 2,85 millones de $ | 248.887 $ | 252.000 $ | 2,35 millones de $ | 2,85 millones de $ |
| A5 | 925.000 $ | 316.233 $ | 599.178 $ | 1,47 millones de $ | 3,31 millones de $ | 263.527 $ | 0 $ | 3,05 millones de $ | 3,31 millones de $ |
28. Indicadores financieros y análisis financiero
| Indicador | Fórmula / base | Resultado base | Interpretación |
|---|---|---|---|
| Margen bruto | Ingresos menos coste de ventas dividido por ingresos | 29.6% | Positivo si se controlan la resina y el peso de la botella |
| Margen de contribución | Precio de venta menos coste variable | 800 USD/tonelada | Utilizado para el punto de equilibrio |
| Cantidad de equilibrio | Coste fijo + depreciación dividido por contribución | 831 toneladas/año | Requiere el 36,9% de utilización |
| ROI | Beneficio neto promedio dividido por la inversión | 21.0% | Positivo después de la puesta en marcha |
| VAN | Flujo de caja no apalancado descontado al 12% | $244,350 | Positivo pero sensible al precio y al costo de la resina |
| TIR | Tasa de descuento donde el VAN es igual a cero | 16.0% | Superior a la tasa de rentabilidad del 12% |
| Recuperación de la inversión | Recuperación acumulada de efectivo de capital apalancado | Durante el Año 4 | Depende del capital de trabajo y del aumento de las ventas |
| Deuda a capital | Deuda dividida por capital | 1.50x | Apalancamiento moderado |
| Requisito mínimo de efectivo | Capital de trabajo inicial | $250,000 | Necesario para resina, preformas y cuentas por cobrar |
29. Análisis de Punto de Equilibrio
Contribución por tonelada = 2,700 − 1,900 = 800 USD/tonelada. Cantidad de equilibrio = costo fijo más depreciación ($665,000) ÷ contribución = 831 toneladas/año. Ingresos de equilibrio = $2.24m y utilización de equilibrio = 36.9% de la capacidad vendible anual.
Fuente: modelo de caso base calculado, 2026. Unidad: porcentaje de la capacidad vendible anual.
30. Análisis de Sensibilidad
| Variable analizada | Impacto en el VAN | Criticidad |
|---|---|---|
| Precio de venta -10% | $-620,000 | Alta |
| Costo de resina/preforma de PET +10% | $-510,000 | Alta |
| Utilización de ventas -10% | $-320,000 | Alta |
| Electricidad +10% | $-76,000 | Media |
| Mano de obra +10% | $-64,000 | Media |
| Costo de capital +10% | $-210,000 | Alta |
| Intereses +2 pts | $-42,000 | Media |
| Retraso en el lanzamiento 6 meses | $-260,000 | Alta |
| Precio de venta +10% | $620,000 | Alta |
Fuente: modelo de sensibilidad calculado, 2026. Unidad: impacto en USD en el VAN.
Clasificación de variables críticas: el precio de venta, el costo de la resina/preforma de PET, la utilización, el retraso en el lanzamiento y el costo de capital son los principales impulsores de la viabilidad.
31. Requisitos Legales y Regulatorios
Los requisitos normalmente incluyen registro de la empresa, licencia industrial, aprobación ambiental, aprobación de seguridad contra incendios, normas de seguridad laboral, registro fiscal, soporte de etiquetado/trazabilidad para envases en contacto con alimentos y procedimientos de gestión de residuos. Las declaraciones de botellas en contacto con alimentos requieren resina/aditivos verificados y aprobación local; los recursos de la FDA y la EFSA proporcionan un contexto de referencia pero no reemplazan el cumplimiento nacional [4][5].
32. Análisis de Medio Ambiente, Salud y Seguridad

Los problemas de EHS incluyen unidades de inyección en caliente, calentadores de moldeo por soplado, aire a alta presión, compresores, enfriadores, transportadores móviles, manipulación de moldes, polvo de resina, carga de fuego, ruido y gestión de residuos. La guía de la OSHA para la industria del plástico destaca la protección de máquinas, el bloqueo, la ventilación y la ergonomía [6]. La planificación ambiental debe cubrir la segregación de residuos, la ruta de reciclaje, los residuos de envases y las normas sobre envases de plástico [7][8].
33. Análisis de Riesgos y Registro de Riesgos
| Riesgo | Probabilidad | Impacto | Mitigación |
|---|---|---|---|
| Aumento del precio de la resina/preforma de PET | Alta | Alto | Contratos con proveedores y términos de ajuste de precios |
| Retraso en la aprobación del cliente | Media | Alto | Muestras previas al lanzamiento, planos y aprobación de moldes |
| Tiempo de inactividad del aire a alta presión | Media | Alto | Dimensionamiento correcto del compresor y mantenimiento preventivo |
| Exceso de peso de la botella | Media | Alto | Pruebas de aligeramiento y controles de calidad |
| Problema de cumplimiento de contacto con alimentos | Bajo-medio | Alto | Resina aprobada, procedimientos de higiene y documentación |
| Proveedores existentes fuertes | Alta | Medio-alto | Servicio, moldes personalizados y entrega fiable |
| Retraso en el cobro de cuentas | Media | Medio | Límites de crédito, depósitos y controles de cobro |
34. Calendario de Implementación
| Fase | Duración | Tareas clave |
|---|---|---|
| Localización de la viabilidad | 2–4 semanas | Datos del país, precios de PET, entrevistas con compradores y mezcla de botellas |
| Ingeniería, permisos y cotizaciones | 1–2 meses | Diseño, servicios, moldes, permisos y ofertas de proveedores |
| Adquisiciones y fabricación | 2–3 meses | Máquinas, moldes, compresor y envío |
| Obras civiles y servicios | 2–3 meses | Electricidad, aire, enfriador, almacén y configuración de control de calidad |
| Instalación y puesta en marcha | 4–6 semanas | Instalación de máquinas, pruebas de moldes y aprobación de muestras |
| Lanzamiento comercial | 1 mes | Incorporación de compradores, primeros pedidos y monitoreo de calidad |
Fuente: supuesto de planificación de implementación, 2026. Unidad: meses.
Gráficos Basados en Datos
Fuente: modelo de caso base calculado, 2026. Unidad: millones de USD.
Fuente: modelo de caso base calculado, 2026. Unidad: miles de USD.
Fuente: supuesto de aumento, 2026. Unidad: porcentaje.
Fuente: modelo de inversión, 2026. Unidad: USD.
Fuente: supuesto de estructura de costos, 2026. Unidad: participación del costo variable.
Fuente: calendario de deuda, 2026. Unidad: miles de USD.
35. Fuentes y Supuestos
Registro de Supuestos
| Supuesto | Valor | Base | Confianza | Efecto |
|---|---|---|---|---|
| Moneda | USD | Supuesto del analista | Media | Todos los resultados |
| Capacidad | 2,250 t/año de botellas de PET terminadas; aproximadamente 90 millones de botellas de 25 g/año | Supuesto de planificación calculado | Media | Ingresos |
| Precio de venta | USD 2,700/t | Supuesto de planificación combinado ex-fábrica | Baja-media | Ingresos y margen |
| Costo variable | USD 1,900/t | Resina/preformas de PET, envases, servicios, mano de obra y residuos | Media | Margen bruto |
| Inversión total | $2.10m | Maquinaria presupuestaria y asignación de fábrica | Media | VAN y financiación |
| Financiación | 40% capital, 60% deuda, 9%, cinco años | Supuesto del analista | Baja-media | Flujo de caja |
| Impuestos y descuento | 20% impuestos, 12% descuento | Supuesto de planificación | Baja-media | VAN y beneficio neto |
Registro de Fuentes
| Ref | Organización | Fuente y URL | Datos utilizados | Fecha de acceso | Confianza |
|---|---|---|---|---|---|
| [1] | Banco Mundial | Indicadores de Desarrollo Mundial: Manufactura, valor agregado, https://api.worldbank.org/v2/indicator/NV.IND.MANF.CD | Fuente de contexto de manufactura | 6 de agosto de 2026 | Alta |
| [2] | Banco Mundial | Indicadores de Desarrollo Mundial: Población total, https://api.worldbank.org/v2/indicator/SP.POP.TOTL | Contexto de localización de la demanda | 6 de agosto de 2026 | Alta |
| [3] | USITC / HTS | Capítulo 39 plásticos y artículos, https://hts.usitc.gov/reststop/file?release=currentRelease&filename=Chapter%2039 | Advertencia del Capítulo 39 del SA y SA 3923 | 6 de agosto de 2026 | Alta para referencia SA |
| [4] | FDA | Sustancias en Contacto con Alimentos, https://www.fda.gov/food/food-ingredients-packaging/food-contact-substances-fcs | Contexto de envases en contacto con alimentos | 6 de agosto de 2026 | Media-alta; aún se requiere ley local |
| [5] | EFSA | Materiales en contacto con alimentos, https://www.efsa.europa.eu/en/topics/topic/food-contact-materials | Contexto de materiales en contacto con alimentos | 6 de agosto de 2026 | Alta para el contexto de la UE |
| [6] | OSHA | Industria del Plástico - Peligros y Soluciones, https://www.osha.gov/plastic-industry/hazards-solutions | Contexto de peligros de seguridad del plástico | 6 de agosto de 2026 | Alta |
| [7] | PNUMA | Contaminación por plástico, https://www.unep.org/plastic-pollution | Contexto de política ambiental | 6 de agosto de 2026 | Media-alta |
| [8] | Comisión Europea | Residuos de envases, https://environment.ec.europa.eu/topics/waste-and-recycling/packaging-waste_en | Contexto regulatorio de residuos de envases | 6 de agosto de 2026 | Alta para el contexto de la UE |
36. Sección de Consulta
¿Necesita un estudio de fábrica de botellas de PET localizado?
Para un informe bancable de fábrica de botellas de PET, confirme el país, la ciudad, los tamaños de botella objetivo, la estrategia de preformas o resina, el precio del PET, la tarifa de servicios públicos, el estado del edificio, los contratos con los clientes, la lista de moldes, los requisitos de contacto con alimentos, la tasa impositiva, los términos de financiación y las cotizaciones de los proveedores. Rolangear puede apoyar la configuración de la línea de botellas de PET, la selección de maquinaria, la planificación de capacidad y la comparación de cotizaciones.
Contactar a Rolangear37. Conclusión y Recomendación Final
La fábrica de botellas de PET es técnicamente factible y financieramente positiva bajo los supuestos presupuestarios establecidos. La inversión es más atractiva cuando la planta asegura clientes de llenado ancla, controla el costo de la resina/preforma de PET, optimiza el peso de la botella, dimensiona correctamente el compresor y el enfriador, y mantiene la documentación de contacto con alimentos. La recomendación es proceder a una validación localizada antes de la inversión final: confirmar la demanda local, los precios de venta, los costos de resina/preforma, los planos de las botellas, los moldes, la idoneidad del edificio, los requisitos ambientales y de contacto con alimentos, y las cotizaciones formales de los proveedores.