Article: Bottled Water Factory Feasibility Study
Bottled Water Factory Feasibility Study
Professional planning study for a medium-scale bottled drinking water plant producing PET bottled water for retail, wholesale, HORECA and institutional channels. Because the user did not specify country, city, bottle mix, land status or quotation, this is a bankable-format preliminary study using transparent USD planning assumptions that must be localized before investment approval.
1. Executive Summary
The proposed project is a bottled water factory focused on purified or treated drinking water packed mainly in PET bottles. The updated base case uses a China-supplier standard-cost planning basis for a 6,000 bottles/hour integrated line, 16 operating hours/day, 300 operating days/year, 85% technical efficiency and annual saleable capacity of 24,480,000 bottles. At a standard ex-factory selling price of 0.11 USD/bottle and ramp-up from 50% to 90% utilization, Year-5 revenue reaches $2.42m and Year-5 net profit reaches $762,810. The revised project investment is $0.88m, based on common Chinese supplier price ranges for water filling lines, PET bottle blowing machines, water treatment, auxiliary utilities and standard installation allowances.
Under these standard-cost assumptions, the preliminary model becomes financially attractive: NPV is $1.27m at a 12% discount rate and IRR is 52.4%. Break-even utilization is 27.6% of saleable capacity. This does not guarantee project success, because final viability still depends on the local selling price, distributor orders, water source, taxes, freight, duties, building condition and exact supplier quotation. The recommendation is to proceed to localized quotation and market validation before investment approval.
2. Study Scope and Methodology

This feasibility study covers project concept, product analysis, economic indicators and project location, target market indicators, demand analysis, local production analysis, import and export analysis, competitor analysis, market-gap analysis, SWOT, marketing, pricing, distribution, machinery, facility, production capacity, supplier quotations and technical offers, raw-material costs, operating requirements, utility requirements, organization, investment cost, financing, revenue forecasts, financial statements, financial indicators, break-even, sensitivity, legal and regulatory requirements, environmental health and safety, risk analysis, implementation schedule, assumptions register, source register, consultation section and final recommendation.
Methodology combines source-backed industry evidence, HS-code caveats, production-capacity formulas, budgetary investment estimates, five-year financial projections, scenario analysis and sensitivity testing. All financial figures are planning estimates in USD unless stated otherwise.
3. Project Concept and Nature

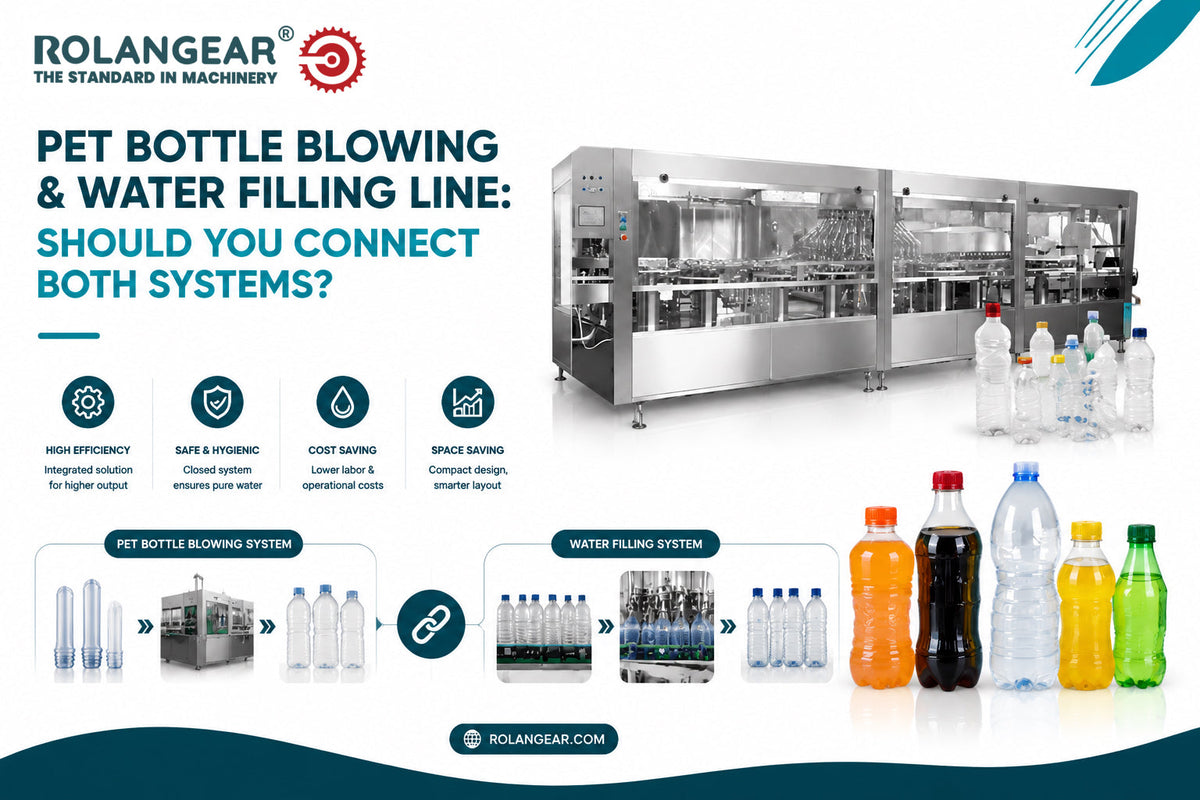
The project nature is an industrial water treatment, bottling and packaging plant. The business model can combine local retail distribution, wholesale supply to supermarkets and distributors, institutional supply to hotels, restaurants, offices and events, and private-label production for retailers. The plant converts raw water from municipal, borehole or approved spring source into bottled drinking water through filtration, treatment, storage, blowing or bottle supply, rinsing, filling, capping, labeling, coding and secondary packaging.
Success factors include reliable raw-water source, brand trust, consistent quality, strong distribution, packaging cost control, food-safety compliance, high line uptime and competitive logistics.
4. Product Analysis and Product Specification Table
Core products are still drinking water in PET bottles. Optional extensions include mineral water, sparkling water, flavored water, large gallons and private-label SKUs. Product compliance must be verified against local bottled water and food safety standards; this study does not claim certification.

| Product | Typical size | Packaging | Target channel | Quality notes |
|---|---|---|---|---|
| Purified drinking water | 330 ml / 500 ml / 1.5 L | PET bottle, cap, label, shrink pack | Retail and HORECA | Requires treatment validation and microbiological testing |
| Family bottle | 5 L | PET/HDPE bottle or jar | Household and office | Lower unit price; logistics heavy |
| Private label water | Customer-defined | Customer brand label | Retail chains and distributors | Requires artwork, quality agreement and contract volume |
5. Economic Indicators and Project Location
Location should be selected using access to safe water source, electricity, road distribution, labor, packaging suppliers, retail proximity, industrial permits and wastewater arrangements. World Bank global data confirms large population and GDP datasets are updated through its API, but country selection is required for precise GDP, inflation, exchange-rate and utility tariff analysis [1].
| Location factor | Weight | Preferred condition | Feasibility effect |
|---|---|---|---|
| Water source and quality | 25% | Reliable approved source with laboratory analysis | Highest impact on treatment cost and permits |
| Distribution access | 20% | Close to retailers, distributors and urban demand | Reduces transport cost |
| Utilities | 15% | Stable power, water rights, drainage | Improves uptime |
| Land/building | 15% | Food-grade industrial facility expansion space | Reduces civil cost |
| Labor and regulation | 15% | Available skilled operators and predictable permits | Reduces launch risk |
| Packaging supply | 10% | Near preform/cap/label suppliers | Reduces working capital |
6. Target-Market Indicators

The bottled water target market includes households, convenience stores, supermarkets, wholesalers, hotels, restaurants, cafés, offices, schools, gyms, factories and public-event suppliers. Global demand is supported by urbanization, health awareness, packaged beverage consumption and cases where consumers prefer packaged water for convenience or perceived safety. WHO states that safe drinking-water is essential to health, and water quality concerns can affect consumer behavior [2]. IBWA identifies bottled water as a widely used packaged beverage category and discusses plastic packaging, recycling and consumer usage [3].
| Market layer | Definition | Planning treatment |
|---|---|---|
| TAM | All packaged drinking water consumption in the target country/region | Not fully available to the project |
| SAM | Customers reachable through planned distribution channels | Estimated after country/city selection |
| Realistically obtainable market | Volume the new plant can capture in 5 years | Limited by brand, distribution, price and capacity |
| Project sales forecast | Ramp-up volume from 50% to 90% utilization | Capped by plant capacity |
7. Demand Analysis
Demand can be estimated by population × bottled-water consumption per capita or by distributor/channel purchase commitments. In this preliminary model, sales are capacity-led because no target country demand data was supplied. Formula: annual saleable capacity = 6,000 bottles/hour × 16 hours/day × 300 days × 85% efficiency = 24,480,000 bottles/year. Expected Year-1 sales = capacity × 50% ramp-up = 12,240,000 bottles.
Confidence level is medium for technical capacity and low-to-medium for market absorption until local market data and customer commitments are verified.
8. Local Production Analysis
Local production analysis must identify existing bottled water brands, water treatment plants, private-label producers, small regional bottlers and imported premium brands. In many markets, bottled water is competitive and distribution-driven. Exact local production volumes cannot be stated without a target country and official industrial production statistics. The study therefore treats local production as a required due-diligence workstream rather than an invented number.
9. Import and Export Analysis with HS-Code Caveats
Likely HS codes include HS 220110 for mineral waters and aerated waters not containing added sugar or flavoring, and HS 220190 for other waters not sweetened or flavored, depending on national customs interpretation. UN Comtrade and ITC Trade Map provide trade-data platforms, but the code can be broader than the planned product and may include mineral/aerated water categories not identical to purified still water [4][5]. Trade data must therefore be used as an indicator, not exact demand.
10. Competitor Analysis
| Competitor type | Examples to research locally | Competitive pressure | Response |
|---|---|---|---|
| Direct local brands | National and regional bottled water factories | High | Compete on distribution, shelf availability and trust |
| Imported premium brands | Imported mineral or spring water | Medium | Position local product as affordable and reliable |
| Substitutes | Filtered tap water, refill stations, water dispensers | Medium to high | Offer convenience and quality assurance |
| New entrants | Small bottlers and private-label plants | Medium | Build contracts and cost control early |
11. Market-Gap Analysis

Market gap should be calculated as estimated demand minus reliable local supply, adjusted for imports and exports. Because local country data was not supplied, the preliminary market gap is not quantified. The project is instead sized as a medium plant requiring only 90.0% utilization by Year 5, which is realistic only if distributors and retail channels can absorb 22,032,000 bottles/year.
12. SWOT Analysis
| Strengths | Weaknesses | Opportunities | Threats |
|---|---|---|---|
| Essential consumer product | No specified country/site yet | Private label and HORECA contracts | Strong incumbent brands |
| Scalable production line | High packaging-cost exposure | Health and convenience trends | Plastic regulation and recycling pressure |
| Simple production process compared with many foods | Distribution intensive | SKU expansion into large bottles | Price competition and retailer margins |
13. Marketing and Promotional Plan

The marketing plan should prioritize distributor agreements, retailer listing, HORECA supply contracts, branded delivery vehicles, point-of-sale material, quality certification communication, digital catalog pages and sampling campaigns. KPIs include active outlets, repeat orders, distribution coverage, return rate, average selling price, on-time delivery and customer complaints.
14. Pricing Plan
The selling-price assumptions below are changed to a more standard bottled-water feasibility basis. They should still be localized by country, brand position, bottle weight, retailer margin and distributor channel.
| SKU | Standard ex-factory price | Pricing logic |
|---|---|---|
| 500 ml bottle | USD 0.11 | Base model assumption before distributor/retailer margin |
| 330 ml bottle | USD 0.08–0.10 | Smaller serving, event and HORECA channel |
| 1.5 L bottle | USD 0.18–0.24 | Family and supermarket channel |
| Private label | Contract-based | Depends on volume, bottle, label, cap, carton/shrink packing and payment terms |
15. Distribution Plan
Distribution should combine direct key-account sales, wholesalers, retail distributors, HORECA delivery, online bulk orders and private-label contracts. Bottled water is heavy and low-margin, so route density, truck utilization and payment collection discipline are critical.
16. Machinery, Equipment, and Production-Line Costs
The machinery cost has been revised to a China-supplier standard-cost basis instead of a high international planning allowance. The ranges below are budgetary reference ranges only and must be confirmed by quotation, capacity, bottle size, automation level, material grade, water-treatment design, Incoterm and destination.
| Machine/equipment | Function | Standard reference cost |
|---|---|---|
| Raw-water storage and feed pumps | Buffer and feed treatment system | Included in utility/treatment package |
| Sand/carbon filtration, RO, UV, ozone and water tanks as required | Water treatment and disinfection | USD 30k–80k |
| PET bottle blowing machine, molds and preform feeding | Bottle manufacturing from PET preforms | USD 45k–90k |
| Rinser-filler-capper monoblock | Main bottled-water filling machine | USD 35k–70k |
| Labeler, date coder, shrink wrapper/carton packer | Branding and secondary packaging | USD 25k–60k |
| Conveyors, air conveyor, compressor, chiller, inspection and spare parts | Line integration and utilities | USD 50k–100k |
| Typical complete equipment package | 6,000 BPH standard bottled water factory line | USD 210k–400k before local civil works, duties and tax |
17. Building, Facility, and Construction Costs

The facility should include raw-water/treatment area, bottling hall, packaging material storage, finished goods warehouse, QA lab, maintenance room, office, staff facilities, loading area and utility room. The model includes $750,000 for land/building fit-out and civil works as a budgetary estimate.
18. Production Capacity and Line Suitability

Rated line capacity is 6,000 bottles/hour. Effective hourly capacity = rated capacity × 85% efficiency = 5,100 bottles/hour. Annual saleable capacity = 24,480,000 bottles. Bottlenecks can occur in bottle blowing, label supply, cap feeding, shrink wrapping, utilities and distribution loading.
19. Supplier Quotations and Technical Offers
No supplier quotation was provided. Machinery and installation values are budgetary estimates only. Final technical offers must confirm bottle sizes, hourly speed, water treatment flow, raw-water analysis, automation level, material grade, spare parts, warranty, Incoterm, destination, installation scope and operator training.
20. Raw-Material Costs
Main raw materials are PET preforms or bottles, caps, labels, shrink film, cartons/trays, treated water, ozone/chemicals, pallets and cleaning supplies. The base variable cost is revised to 0.047 USD/bottle, mainly packaging driven and based on standard PET preform, cap, label, shrink film/carton, water-treatment consumables and factory handling assumptions. Packaging resin prices and local supplier contracts should be confirmed before procurement.
21. Operating Requirements and Expenses

Operating requirements include production operators, QC staff, maintenance, supervisors, warehouse staff, sales/distribution team, power, water, chemicals, packaging procurement, maintenance, insurance, marketing, transport and administration. Annual fixed operating expenses plus maintenance are revised to $360,000 in the standard-cost base case.
22. Utility Requirements
| Utility | Typical requirement to confirm | Feasibility effect |
|---|---|---|
| Electricity | Transformer capacity, 3-phase power, backup generator if needed | Affects uptime and filling speed |
| Water | Approved source, treatment feed rate, storage tanks | Core input and compliance risk |
| Compressed air | Bottle blowing, pneumatic valves and packaging machines | Affects line stability |
| Cooling/chiller | Product/process and compressor conditions where needed | Protects equipment and quality |
| Drainage and wastewater | Washdown, RO reject, sanitation drains | Environmental and hygiene compliance |
23. Organizational and Management Structure
| Role | Headcount | Main responsibility |
|---|---|---|
| General manager | 1 | Operations, sales and financial control |
| Production supervisor | 2 | Shift control and line productivity |
| Operators and packers | 18 | Machine operation, packing and housekeeping |
| Quality/lab staff | 3 | Water testing, records and release |
| Maintenance technicians | 3 | Preventive maintenance and repairs |
| Warehouse/logistics | 6 | Inventory and delivery |
| Sales/admin/finance | 7 | Orders, collections, accounts and customer service |
24. Investment Costs
| Investment item | Standard estimate (USD) | Basis |
|---|---|---|
| Land/building fit-out and civil works | $180,000 | Standard industrial fit-out allowance; excludes land purchase |
| Water treatment, PET blowing, filling/capping, labeling, shrink/carton packing and conveyors | $320,000 | China supplier standard-cost package for a 6,000 BPH class line |
| Utilities: transformer, compressor, chiller, tanks, piping, drainage | $95,000 | Standard auxiliary utility allowance |
| Laboratory, QA, furniture, IT and ERP | $30,000 | Basic QA and administration setup |
| Installation, freight, duties and commissioning budget | $70,000 | Planning allowance; final value depends on destination and Incoterm |
| Vehicles, pallets and material handling | $40,000 | Basic delivery and warehouse handling setup |
| Pre-operating expenses, permits, training and launch | $25,000 | Planning estimate |
| Contingency reserve | $70,000 | Approx. 8% reserve on project cost |
| Initial working capital | $50,000 | Packaging, spare parts and launch inventory allowance |
| Total project investment | $0.88m | Calculated subtotal |
25. Financing Requirements and Conditions

Base financing assumes 40% equity and 60% debt. Equity requirement is $352,000 and loan requirement is $528,000. Loan terms are modeled at 9% annual interest, five-year equal principal repayment and no grace period. Actual financing depends on country, collateral, bank terms and sponsor credit strength.
26. Revenue and Sales Forecasts
| Year | Utilization | Sales volume (bottles) | Revenue | Net profit | DSCR |
|---|---|---|---|---|---|
| Y1 | 50.0% | 12,240,000 | $1.35m | $238,880 | 1.98x |
| Y2 | 65.0% | 15,912,000 | $1.75m | $431,552 | 3.46x |
| Y3 | 75.0% | 18,360,000 | $2.02m | $562,534 | 4.68x |
| Y4 | 85.0% | 20,808,000 | $2.29m | $693,517 | 6.09x |
| Y5 | 90.0% | 22,032,000 | $2.42m | $762,810 | 7.19x |
Optimistic scenario assumes faster distribution and 95% Year-5 utilization. Conservative scenario assumes slower market entry, 75% Year-5 utilization, 5% lower selling price and higher packaging cost. The model is now more sensitive to local selling price and packaging cost than to machinery cost because the equipment budget has been revised to a standard China-supplier level.
27. Financial Statements
| USD | Y1 | Y2 | Y3 | Y4 | Y5 |
|---|---|---|---|---|---|
| Revenue | $1.35m | $1.75m | $2.02m | $2.29m | $2.42m |
| COGS | $575,280 | $747,864 | $862,920 | $977,976 | $1.04m |
| Gross profit | $771,120 | $1.00m | $1.16m | $1.31m | $1.39m |
| EBITDA | $411,120 | $642,456 | $796,680 | $950,904 | $1.03m |
| Depreciation | $65,000 | $65,000 | $65,000 | $65,000 | $65,000 |
| EBIT | $346,120 | $577,456 | $731,680 | $885,904 | $963,016 |
| Interest | $47,520 | $38,016 | $28,512 | $19,008 | $9,504 |
| Tax | $59,720 | $107,888 | $140,634 | $173,379 | $190,702 |
| Net profit | $238,880 | $431,552 | $562,534 | $693,517 | $762,810 |
| USD | Y0 | Y1 | Y2 | Y3 | Y4 | Y5 |
|---|---|---|---|---|---|---|
| Equity / project cash flow | $-352,000 | $198,280 | $390,952 | $521,934 | $652,917 | $722,210 |
| Cumulative cash flow | $-352,000 | $-153,720 | $237,232 | $759,166 | $1.41m | $2.13m |
| Debt principal repayment | - | $105,600 | $105,600 | $105,600 | $105,600 | $105,600 |
| Closing debt | - | $422,400 | $316,800 | $211,200 | $105,600 | $0 |
| USD | Y1 | Y2 | Y3 | Y4 | Y5 |
|---|---|---|---|---|---|
| Fixed assets net | $555,000 | $490,000 | $425,000 | $360,000 | $295,000 |
| Working capital and cash | $50,000 | $287,232 | $809,166 | $1.46m | $2.18m |
| Total assets | $605,000 | $777,232 | $1.23m | $1.82m | $2.48m |
| Debt | $422,400 | $316,800 | $211,200 | $105,600 | $0 |
| Equity and retained earnings | $182,600 | $460,432 | $1.02m | $1.72m | $2.48m |
| Liabilities plus equity | $605,000 | $777,232 | $1.23m | $1.82m | $2.48m |
28. Financial Indicators and Financial Analysis
| Indicator | Formula / basis | Base result | Interpretation |
|---|---|---|---|
| Gross margin | (Revenue - COGS) / Revenue | 57.3% | Healthy if packaging procurement is controlled |
| Contribution margin | Price - variable cost | USD 0.063/bottle | Used for break-even |
| Break-even quantity | Fixed cost / contribution | 6,746,032 | Requires 27.6% utilization |
| ROI | Average net profit / investment | 61.1% | Strong under standard-cost investment assumptions |
| NPV | Unlevered FCFF discounted at 12% | $1.27m | Positive in the revised base case |
| IRR | Discount rate where NPV = 0 | 52.4% | Above the 12% discount rate, subject to local validation |
| Payback | Cumulative levered cash recovery | During Year 2 | Fast payback mainly driven by lower standard investment cost |
| Current ratio | Current assets / current liabilities | >1.0x model target | Must be confirmed with working capital |
| Debt-to-equity | Debt / equity | 1.50x | Moderate leverage |
| DSCR | Operating cash flow / debt service | Y1 1.98x; Y5 7.19x | Comfortable under the revised cost structure |
29. Break-Even Analysis
Contribution per bottle = selling price (0.11) − variable cost (0.047) = 0.063 USD. Break-even units = fixed cost ($425,000) ÷ contribution (0.063) = 6,746,032 bottles/year. Break-even revenue = $742,063. Break-even utilization = 27.6% of saleable capacity.
Source: calculated from revised standard-cost financial model.
30. Sensitivity Analysis
| Variable tested | NPV result | Impact vs base NPV |
|---|---|---|
| Selling price -10% | $724,827 | $-549,183 |
| Sales volume/utilization -10% | $959,478 | $-314,532 |
| Packaging/raw material +10% | $1.04m | $-234,651 |
| Fixed operating expenses +10% | $1.17m | $-103,818 |
| Capital cost +10% | $1.19m | $-88,000 |
| Selling price +10% | $1.82m | $549,183 |
| Raw material -10% | $1.51m | $234,651 |
Critical-variable ranking: selling price, sales volume/utilization and packaging/raw-material cost remain the strongest drivers. The lower standard machinery cost improves the project, but the project still requires realistic distributor demand and disciplined packaging procurement.
31. Legal and Regulatory Requirements
Requirements normally include company registration, industrial license, food establishment approval, water abstraction/source permit where applicable, bottled water standard compliance, label approval, hygiene inspection, tax registration, labor permits, environmental approval and product testing. FDA notes bottled water is regulated as a packaged food in the United States, while local rules differ by country [6]. EPA drinking-water rules apply to public water systems in the United States and may differ from packaged-water rules [7]. Local legal review is required.
32. Environmental, Health, and Safety Analysis

EHS issues include water-source sustainability, RO reject water, wastewater, chemical handling, PET packaging waste, noise, compressed-air safety, forklift traffic and worker hygiene. The project should implement HACCP-style controls, sanitation procedures, traceability, recall plan, pest control, recycling partnerships and wastewater management.
33. Risk Analysis and Risk Register
| Risk | Probability | Impact | Mitigation |
|---|---|---|---|
| Water quality/source failure | Medium | High | Complete raw-water test, treatment design and backup source |
| Packaging cost increase | High | High | Multi-supplier contracts and inventory planning |
| Slow distribution ramp-up | Medium | High | Pre-launch distributor agreements |
| Price competition | High | Medium | Cost control, route density and quality positioning |
| Regulatory delay | Medium | High | Early permits and lab documentation |
| Machine downtime | Medium | Medium | Preventive maintenance and spare parts |
34. Implementation Schedule
| Phase | Duration | Key tasks |
|---|---|---|
| Feasibility localization | 2–4 weeks | Country data, customer validation, site screening |
| Engineering and permits | 1–2 months | Water analysis, layout, licenses, utility design |
| Procurement | 2–3 months | Supplier quotation, contract, manufacturing |
| Civil works and utilities | 2–4 months | Building, power, drainage, tanks |
| Installation and commissioning | 3–6 weeks | Machine installation, testing, training |
| Commercial launch | 1 month | Distributor onboarding and retail launch |
35. Sources and Assumptions
Assumptions Register
| Assumption | Value | Basis | Confidence | Effect |
|---|---|---|---|---|
| Currency | USD | Analyst assumption | Medium | All financial outputs |
| Line capacity | 6,000 bottles/hour | Budgetary machinery planning assumption | Medium | Revenue and capex |
| Operating schedule | 16 h/day, 300 days/year | Industry planning assumption | Medium | Capacity |
| Selling price | USD 0.11/bottle | Standard cost model estimate; must be localized | Medium | Revenue and NPV |
| Variable cost | USD 0.047/bottle | Standard cost model estimate; packaging driven | Medium | Margin |
| Debt terms | 60%, 9%, 5 years | Analyst assumption | Low-medium | Cash flow and DSCR |
Source Register
| Ref | Organization | Source and URL | Data used | Access date | Confidence |
|---|---|---|---|---|---|
| [1] | World Bank | World Bank Data API: https://api.worldbank.org/ | Economic and demographic data availability; country-specific data required | 2026-08-05 | High |
| [2] | World Health Organization | Drinking-water factsheet: https://www.who.int/news-room/fact-sheets/detail/drinking-water | Safe drinking-water health context | 2026-08-05 | High |
| [3] | International Bottled Water Association | Bottled Water Facts: https://bottledwater.org/bottled-water-facts/ | Industry category and packaging context | 2026-08-05 | Medium |
| [4] | UN Comtrade | UN Comtrade platform: https://comtradeplus.un.org/ | Trade-data source for HS-code analysis | 2026-08-05 | High |
| [5] | International Trade Centre | Trade Map: https://www.trademap.org/ | Trade-data source and HS-code review platform | 2026-08-05 | High |
| [6] | U.S. FDA | Bottled water safety/regulatory guidance, FDA website | Example regulatory treatment as packaged food; local rules differ | 2026-08-05 | High |
| [7] | U.S. EPA | Drinking water regulations, EPA website | Example public drinking-water regulatory context; local rules differ | 2026-08-05 | High |
| [8] | Precedence Research | Bottled Water Market: https://www.precedenceresearch.com/bottled-water-market | Commercial market-size reference; not used for country demand without localization | 2026-08-05 | Medium |
36. Consultation Section
Need a Localized Bottled Water Factory Study?
For a bankable report, confirm country, city, water source analysis, land/building status, target bottle sizes, capacity, selling prices, distributor commitments, supplier quotation, utility tariffs, tax rate and financing terms. Rolangear can support production-line configuration, machinery selection, capacity planning and quote comparison for bottled water factory projects.
Contact Rolangear37. Final Conclusion and Recommendation
The bottled water factory is technically feasible and financially attractive under the revised standard-cost assumptions, provided that the investor can achieve the assumed ex-factory selling price, distributor-backed utilization and packaging cost control. The revised model uses a more realistic China-supplier-style investment basis, so the project indicators are stronger than the earlier conservative model. The recommendation is conditional approval for the next stage: obtain formal supplier quotations, confirm freight/duties/taxes, test local selling prices, verify water-source quality and rerun the model with country-specific data before final investment.
Data-Driven Charts
Source: revised standard-cost model from stated assumptions.
Source: revised standard-cost model from stated assumptions.