Juice Production Factory Feasibility Study
Juice Production Factory Feasibility Study
Professional feasibility study for a small-to-medium juice production factory producing bottled fruit juice drinks, nectar beverages, pasteurized juices and private-label packs. Because no country, recipe, material price, utility tariff, building condition or supplier quotation was supplied, this report uses transparent USD planning assumptions that must be localized before investment approval.
Study Map
1. Executive Summary
The project is a juice production factory producing bottled fruit juice drinks, nectar-style beverages, mixed fruit drinks, pasteurized juices and private-label beverage packs. The base case assumes a 3,000 L/hour processing and filling line, 8 hours/day, 300 operating days/year and 95% saleable yield, giving 6,840,000 liters/year of saleable product.

Using a blended ex-factory selling price of USD 0.55/liter, variable cost of USD 0.34/liter and total investment of $1.43m, Year-5 revenue reaches $3.39m and Year-5 net profit reaches $543,682. Base NPV is $312,053 at a 12% discount rate, estimated IRR is 19.2%, and break-even utilization is 37.9%.
2. Study Scope and Methodology
This study covers market, technical, operating, staffing, investment, financing, revenue, financial statements, indicators, break-even, sensitivity, legal, EHS, risk, implementation, sources, consultation and final recommendation. World Bank indicators support macro and demand-localization context [1][2]. FAOSTAT supports crop and fruit-supply localization [3]. Codex fruit juice standards, FDA Juice HACCP, HS Chapter 20 and WHO diet guidance provide product, safety, trade and demand-context references [4][5][6][7].
3. Project Concept and Nature
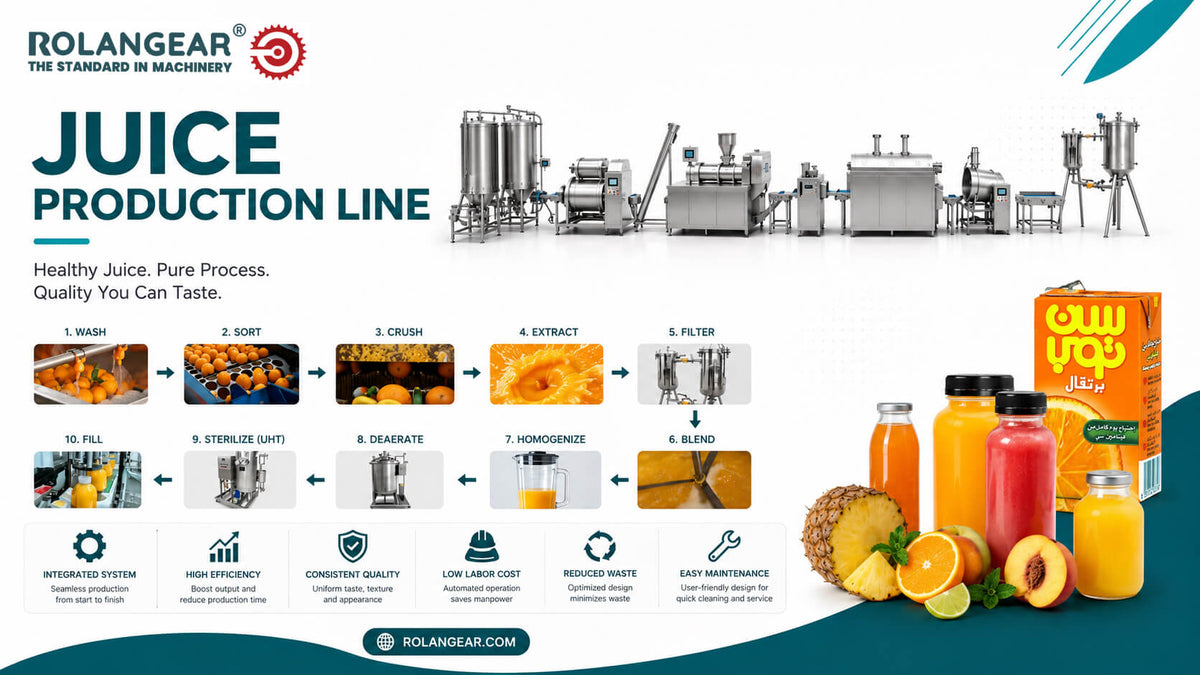
The project is a food and beverage processing factory. Fruit pulp, juice concentrate or fresh fruit is received, inspected, washed where applicable, extracted or diluted/blended, filtered, standardized, pasteurized, filled, capped, labeled, packed and distributed. The business model can combine retail bottled drinks, HORECA supply, school/institutional channels and private-label production.

4. Product Analysis and Product-Specification Table
Product specifications include fruit type, juice percentage, Brix, acidity, pulp content, preservatives if allowed, bottle size, closure, shelf life, storage condition and labeling. Do not claim “100% juice”, organic, preservative-free or fortified status unless formulation and certification are verified.
| Product | Typical specification | Target customer | Quality notes |
|---|---|---|---|
| Bottled fruit juice drink | 200 ml to 1 L PET or glass bottles | Retail and groceries | Brix, acidity, flavor and shelf-life control |
| Nectar-style beverages | Mango, guava, peach or mixed fruit | Supermarkets, schools, cafés | Pulp stability and viscosity |
| Pasteurized juice | Fresh or concentrate-based product | Hotels, restaurants, premium retail | Cold-chain or shelf-stable rules must be verified |
| Private-label juice packs | Buyer-specific bottle, label and carton | Retail chains and distributors | Artwork, barcode and recipe approval |
| Bulk juice / HORECA packs | Larger bottles or bag-in-box where selected | Restaurants and institutions | Cost-efficient packing and delivery |
5. Economic Indicators and Project Location
Juice demand is linked to population, retail development, disposable income, school/HORECA demand, tourism, fruit availability and competition from carbonated drinks, water and dairy drinks. World Bank population and manufacturing indicators help screen target markets [1][2]. Location should prioritize fruit or concentrate supply, clean water, utilities, packaging suppliers, cold/dry storage and distribution routes.
| Factor | Weight | Preferred condition | Effect |
|---|---|---|---|
| Fruit/concentrate supply | 24% | Near fruit farms, pulp suppliers, concentrate importers or ports | Controls product cost and continuity |
| Water and utilities | 18% | Reliable treated water, power, steam/hot water and compressed air | Affects food safety and uptime |
| Distribution routes | 16% | Near supermarkets, schools, HORECA and wholesalers | Improves delivery cost |
| Food-grade building | 15% | Drainage, washable surfaces and pest control | Reduces compliance risk |
| Packaging supply | 11% | Bottles, caps, labels, cartons and shrink film available | Controls working capital |
| Labor and QA availability | 9% | Food technologist, operators and QC staff | Supports quality |
| Regulatory clarity | 7% | Clear food licensing and labeling rules | Reduces launch delay |
6. Target-Market Indicators with TAM, SAM and Realistically Obtainable Market Separation
| Layer | Definition | Planning treatment |
|---|---|---|
| TAM | All bottled juice, nectar, fruit drink and similar beverage demand in the target country | Not fully available to one factory |
| SAM | Demand reachable through planned retail, HORECA, schools and distributors | Requires local channel validation |
| Realistically obtainable market | Volume a new juice factory can capture within five years | Limited by brand, price, shelf access and route network |
| Project sales forecast | Ramp-up to 6,156,000 liters/year by Year 5 | Capacity-led forecast, not a market-share claim |
7. Demand Analysis
Because no country was supplied, this report uses a capacity-led forecast. Formula: 3,000 L/hour × 8 hours/day × 300 days/year × 95% yield = 6,840,000 liters/year. Year-1 sales are 3,420,000 liters; Year-5 sales are 6,156,000 liters. Local demand should later be calculated from population × annual juice consumption, retail outlet counts, school/HORECA customers, apparent consumption and distributor interviews.

8. Local Production Analysis
Local production analysis should identify national beverage companies, juice concentrate bottlers, fresh juice processors, dairy/juice brands, private-label packers, imported juice brands and informal fresh-juice suppliers. Exact local production is not stated because no country was provided; it must be verified through food-industry registries, store checks, distributor interviews and trade data.
9. Import and Export Analysis with HS-Code Caveats
Likely HS codes fall under Chapter 20 for preparations of vegetables, fruit, nuts or other parts of plants; fruit and vegetable juices are commonly reviewed under HS 2009, but national subheadings separate orange, apple, grape and other juices [6]. HS 2009 can include concentrates and different juice types, so trade data must not be treated as exact demand for the project’s finished bottled products without subheading validation.
10. Competitor Analysis
| Competitor type | Examples to research locally | Pressure | Response |
|---|---|---|---|
| Large beverage companies | National juice and soft-drink brands | High | Compete with local flavors, price and distributor service |
| Small juice processors | Local bottled juice and nectar producers | Medium-high | Improve consistency, labeling and shelf life |
| Imported juice brands | Premium and regional juice products | Medium | Offer fresher local supply and value packs |
| Substitutes | Water, soda, dairy drinks, powdered drinks | High | Position by flavor, fruit content and pack value |
| New entrants | Filling-line operators adding juice SKUs | Medium | Secure recipes, distributors and packaging early |
11. Market-Gap Analysis
Market gap should equal estimated juice demand minus reliable local production and imports, adjusted for substitute beverages and shelf access. In this preliminary model, the factory needs to sell 6,156,000 liters by Year 5. This requires distributor commitments, retail sampling, school/HORECA trials and price testing before final approval.

12. SWOT Analysis
| Strengths | Weaknesses | Opportunities | Threats |
|---|---|---|---|
| Broad beverage demand and flexible flavors | Requires strict food safety and shelf-life control | Private label, schools and HORECA channels | Fruit/concentrate and packaging price volatility |
| Moderate processing complexity | Brand building and retail listing take time | Local fruit flavors and value packs | Strong beverage competitors |
| Scalable line and multiple bottle sizes | Returns can rise if shelf life is weak | Import substitution and seasonal promotions | Regulatory or sugar-labeling pressure |
13. Marketing and Promotional Plan
The marketing plan should focus on product sampling, retail listing, distributor margins, school/institutional packs, HORECA supply, private-label offers, seasonal flavors and point-of-sale visibility. KPIs include active outlets, repeat orders, returns, complaint rate, Brix consistency, production yield, delivery fill rate and receivable days.
14. Pricing Plan
| Product | Planning selling price | Pricing logic |
|---|---|---|
| Fruit juice drink, PET bottle | USD 0.45–0.65/L | Main value line by bottle size and fruit content |
| Nectar-style beverage | USD 0.50–0.75/L | Pulp, Brix and fruit cost drive price |
| Premium pasteurized juice | USD 0.80–1.40/L | Cold-chain and higher fruit content may support premium |
| Private-label bottles | Contract-based | Depends on recipe, pack, label and volume |
| Blended model price | USD 0.55/L | Used for base financial model |
15. Distribution Plan
Distribution should combine wholesalers, supermarkets, mini-markets, schools, cafés, restaurants, hotels and selected institutional buyers. Route planning must control product damage, shelf-life rotation, returns, credit exposure and refrigeration needs where applicable.
16. Machinery, Equipment, and Production-Line Costs

Machinery costs are budgetary planning estimates, not supplier quotations. Final cost depends on fresh-fruit versus concentrate processing, pasteurization method, bottle type, filling speed, CIP system, labeler, packaging automation and destination.
| Machine/equipment | Function | Budgetary estimate |
|---|---|---|
| Fruit washing, sorting and pulping/extraction system | Fresh fruit preparation where applicable | USD 90k–220k |
| Mixing, sugar syrup and blending tanks | Recipe preparation and standardization | USD 70k–160k |
| Filtration, homogenization and deaeration tools | Texture and quality control | USD 60k–150k |
| Pasteurizer and holding system | Heat treatment and shelf-life control | USD 120k–280k |
| Bottle rinsing, filling and capping line | Primary filling operation | USD 180k–420k |
| Labeling, date coding and shrink/carton packing | Final packaging | USD 90k–230k |
| CIP, water treatment, boiler/chiller/compressor | Food-grade utilities | USD 110k–260k |
17. Building, Facility, and Construction Costs
The facility should include raw-fruit or concentrate receiving, ingredient storage, water-treatment area, processing room, filling room, packaging store, finished goods warehouse, QC lab, CIP area, waste-water handling, staff hygiene area, office and dispatch bay. Floors, drainage, washable surfaces, ventilation and pest control are important.
18. Production Capacity and Line Suitability

Rated line capacity is 3,000 L/hour. Annual saleable output = 3,000 × 8 hours/day × 300 days/year × 95% yield = 6,840,000 liters/year. Bottlenecks may occur in fruit preparation, pasteurizer holding time, bottle supply, filling speed, labeler uptime, carton packing, cooling/storage and distribution.
19. Supplier Quotations and Technical Offers
No supplier quotation was provided. Final technical offers should confirm product type, bottle size, filling temperature, pasteurization target, CIP design, material contact surfaces, output speed, power/steam/compressed-air load, spare parts, installation, training, warranty and Incoterm.
20. Raw-Material Costs
Main inputs are fruit, pulp or concentrate, sugar or sweetener, citric acid, stabilizers where allowed, water, bottles, caps, labels, cartons, shrink film, cleaning chemicals and pallets. The base variable cost is USD 0.34/liter, including ingredients, packaging, utilities, direct labor and normal losses.

21. Operating Requirements and Expenses
Annual fixed operating expenses are estimated at $420,000 in Year 1 before depreciation, increasing 3% annually. This covers management, production supervision, QA, maintenance, sales/admin, security, insurance, sanitation, pest control, basic marketing and overhead.
22. Utility Requirements
| Utility | Requirement to confirm | Effect |
|---|---|---|
| Treated water | Product water and washing/CIP water | Core quality and safety requirement |
| Electricity | 3-phase power for pumps, fillers, conveyors and packaging | Controls uptime |
| Steam/hot water | Pasteurization and CIP | Major process requirement |
| Compressed air | Filling, capping and packaging controls | Line stability |
| Chilled water/cooling | Product cooling where required | Shelf-life and storage control |
| Wastewater treatment | Fruit waste, sugar water and cleaning discharge | Regulatory and EHS requirement |
23. Organizational and Management Structure
| Role | Headcount | Main responsibility |
|---|---|---|
| General manager | 1 | Operations, sales and finance |
| Production manager / food technologist | 1 | Recipe, process, yield and food safety |
| Shift supervisors | 2 | Daily production execution |
| Processing operators | 6 | Fruit prep, blending and pasteurization |
| Filling/packing operators | 12 | Filling, capping, labeling and packing |
| Quality/lab staff | 3 | Brix, pH, microbiology and release checks |
| Maintenance and utilities | 3 | Boiler, pumps, filler and utilities |
| Warehouse/dispatch | 5 | Raw materials, finished goods and loading |
| Sales/admin/accounting | 5 | Orders, invoicing and customer service |
24. Investment Costs
| Investment item | Estimate | Basis |
|---|---|---|
| Juice processing, blending and pasteurization line | $430,000 | Budgetary processing package |
| Bottle filling, capping, labeling and packing line | $360,000 | Packaging automation allowance |
| Water treatment, CIP, boiler/chiller/compressor utilities | $170,000 | Food-grade utility allowance |
| Building fit-out, drainage, hygiene and warehouse | $80,000 | Existing-building allowance |
| QC lab, handling, cold/dry storage and IT tools | $210,000 | Support equipment |
| Freight, installation, training and commissioning | $60,000 | Destination-dependent allowance |
| Pre-operating expenses, permits and launch | $35,000 | Planning estimate |
| Contingency reserve | $85,000 | Approximate reserve |
| Initial working capital | $180,000 | Ingredients, packaging, inventory and receivables |
| Total project investment | $1.43m | Calculated subtotal |
25. Financing Requirements and Conditions
Base financing assumes 40% equity and 60% debt. Equity requirement is $572,000 and loan requirement is $858,000. Loan terms are modeled at 9% annual interest, five-year equal principal repayment and no grace period. Final terms depend on lender, collateral, country risk and confirmed investment scope.
26. Revenue and Sales Forecasts
| Year | Utilization | Sales volume, liters | Revenue | Gross profit | EBITDA | Net profit | DSCR |
|---|---|---|---|---|---|---|---|
| Y1 | 50.0% | 3,420,000 | $1.88m | $718,200 | $298,200 | $76,784 | 1.12x |
| Y2 | 65.0% | 4,446,000 | $2.45m | $933,660 | $501,060 | $251,427 | 1.88x |
| Y3 | 75.0% | 5,130,000 | $2.82m | $1.08m | $631,722 | $368,312 | 2.48x |
| Y4 | 85.0% | 5,814,000 | $3.20m | $1.22m | $761,995 | $484,885 | 3.16x |
| Y5 | 90.0% | 6,156,000 | $3.39m | $1.29m | $820,046 | $543,682 | 3.66x |
| Scenario | Key assumptions | Y5 sales | Y5 revenue | Interpretation |
|---|---|---|---|---|
| Conservative | 70% utilization; price -6%; ingredients +5% | 4.79m L | $2.48m | Marginal; requires cost and route discipline |
| Base case | 90% utilization; USD 0.55/L price | 6,156,000 L | $3.39m | Positive under assumptions |
| Optimistic | 95% utilization; premium SKU mix and stable packaging | 6.50m L | $3.75m | Strong if distributors are secured |
27. Financial Statements
| Year | Utilization | Sales volume | Revenue | Gross profit | EBITDA | Net profit | DSCR |
|---|---|---|---|---|---|---|---|
| Y1 | 50.0% | 3,420,000 | $1.88m | $718,200 | $298,200 | $76,784 | 1.12x |
| Y2 | 65.0% | 4,446,000 | $2.45m | $933,660 | $501,060 | $251,427 | 1.88x |
| Y3 | 75.0% | 5,130,000 | $2.82m | $1.08m | $631,722 | $368,312 | 2.48x |
| Y4 | 85.0% | 5,814,000 | $3.20m | $1.22m | $761,995 | $484,885 | 3.16x |
| Y5 | 90.0% | 6,156,000 | $3.39m | $1.29m | $820,046 | $543,682 | 3.66x |
| Year | Operating cash flow | Debt principal repayment | Levered cash flow | Cumulative equity cash flow | Closing debt |
|---|---|---|---|---|---|
| Y1 | $201,784 | $171,600 | $30,184 | $-541,816 | $686,400 |
| Y2 | $376,427 | $171,600 | $204,827 | $-336,989 | $514,800 |
| Y3 | $493,312 | $171,600 | $321,712 | $-15,277 | $343,200 |
| Y4 | $609,885 | $171,600 | $438,285 | $423,009 | $171,600 |
| Y5 | $668,682 | $171,600 | $497,082 | $920,090 | $0 |
| Year | Net fixed assets | Inventory | Receivables | Cash | Total assets | Payables | Loan balance | Equity + retained earnings | Liabilities + equity |
|---|---|---|---|---|---|---|---|---|---|
| Y1 | $1.12m | $79,644 | $180,370 | $13,885 | $1.40m | $63,715 | $686,400 | $648,784 | $1.40m |
| Y2 | $1.00m | $103,537 | $234,481 | $159,823 | $1.50m | $82,830 | $514,800 | $900,211 | $1.50m |
| Y3 | $875,000 | $119,466 | $270,555 | $442,275 | $1.71m | $95,573 | $343,200 | $1.27m | $1.71m |
| Y4 | $750,000 | $135,395 | $306,629 | $841,301 | $2.03m | $108,316 | $171,600 | $1.75m | $2.03m |
| Y5 | $625,000 | $143,359 | $324,666 | $1.32m | $2.41m | $114,687 | $0 | $2.30m | $2.41m |
28. Financial Indicators and Financial Analysis
| Indicator | Formula / basis | Base result | Interpretation |
|---|---|---|---|
| Gross margin | Revenue minus COGS divided by revenue | 38.2% | Positive if ingredients and packaging are controlled |
| Contribution margin | Selling price minus variable cost | USD 0.21/liter | Used for break-even |
| Break-even quantity | Fixed cost + depreciation divided by contribution | 2,595,238 liters/year | Requires 37.9% utilization |
| ROI | Average net profit divided by investment | 24.1% | Positive after ramp-up |
| NPV | Unlevered cash flow discounted at 12% | $312,053 | Positive but sensitive to price and ingredients |
| IRR | Discount rate where NPV equals zero | 19.2% | Above the 12% hurdle rate |
| Payback | Cumulative levered equity cash recovery | During Year 4 | Depends on distributor growth |
| Debt-to-equity | Debt divided by equity | 1.50x | Moderate leverage |
| Minimum cash requirement | Initial working capital | $180,000 | Needed for ingredients, packaging and receivables |
29. Break-Even Analysis
Contribution per liter = 0.55 − 0.34 = 0.21 USD/liter. Break-even quantity = fixed cost plus depreciation ($545,000) ÷ contribution = 2,595,238 liters/year. Break-even revenue = $1.43m and break-even utilization = 37.9% of annual saleable capacity.
Source: calculated base-case model, 2026. Unit: percent of annual saleable capacity.
30. Sensitivity Analysis
| Variable tested | NPV impact | Criticality |
|---|---|---|
| Selling price -10% | $-455,000 | High |
| Fruit/concentrate cost +10% | $-310,000 | High |
| Sales utilization -10% | $-230,000 | High |
| Packaging cost +10% | $-115,000 | Medium |
| Sugar/additives +10% | $-42,000 | Medium |
| Labor +10% | $-52,000 | Medium |
| Capital cost +10% | $-143,000 | Medium |
| Launch delay 6 months | $-175,000 | High |
| Selling price +10% | $455,000 | High |
Source: calculated sensitivity model, 2026. Unit: USD impact on NPV.
Critical-variable ranking: selling price, fruit/concentrate cost, sales utilization, launch delay and packaging cost are the main viability drivers.
31. Legal and Regulatory Requirements
Requirements normally include company registration, food-processing license, product labeling approval, food-safety plan, HACCP-style controls, water-quality approval, tax registration, fire safety, worker health rules, environmental approval and delivery vehicle compliance. FDA Juice HACCP and Codex fruit juice standards provide reference context, but local law controls final requirements [4][5].
32. Environmental, Health, and Safety Analysis

EHS issues include hot water/steam, pasteurizer burns, bottle handling, chemical CIP, wet floors, fruit waste, wastewater, moving conveyors, compressed air, forklifts, pest control and microbiological hazards. The project should implement HACCP-style controls, sanitation SOPs, traceability, allergen/ingredient management and wastewater handling.
33. Risk Analysis and Risk Register
| Risk | Probability | Impact | Mitigation |
|---|---|---|---|
| Fruit or concentrate price increase | High | High | Supplier contracts and recipe-cost review |
| Packaging shortage | Medium | High | Multiple bottle, cap, label and carton suppliers |
| Food-safety or shelf-life issue | Low-medium | High | HACCP, pasteurization validation and lab checks |
| Slow distributor adoption | Medium | High | Sampling, margin plan and route agreements |
| High returns/expired stock | Medium | Medium-high | Demand forecasting and shelf-life rotation |
| Utility or water-quality interruption | Medium | High | Water treatment, backup power and maintenance |
| Receivable delay | Medium | Medium | Credit limits, deposits and collection controls |
34. Implementation Schedule
| Phase | Duration | Key tasks |
|---|---|---|
| Feasibility localization | 2–4 weeks | Country data, recipes, ingredient prices and distributor interviews |
| Engineering, permits and quotations | 1–2 months | Layout, food license, utilities and supplier offers |
| Procurement and manufacturing | 2–3 months | Machines, filler, packaging tools and shipment |
| Civil works and utilities | 2–3 months | Drainage, water treatment, steam/hot water, power and hygiene works |
| Installation and commissioning | 4–6 weeks | Machine installation, CIP, pasteurization and trial production |
| Commercial launch | 1 month | Sampling, route onboarding and first orders |
Source: implementation planning assumption, 2026. Unit: months.
Data-Driven Charts
Source: calculated base-case model, 2026. Unit: USD million.
Source: calculated base-case model, 2026. Unit: USD thousand.
Source: ramp-up assumption, 2026. Unit: percent.
Source: investment model, 2026. Unit: USD.
Source: cost-structure assumption, 2026. Unit: share of variable cost.
Source: debt schedule, 2026. Unit: USD thousand.
35. Sources and Assumptions
Assumptions Register
| Assumption | Value | Basis | Confidence | Effect |
|---|---|---|---|---|
| Currency | USD | Analyst assumption | Medium | All outputs |
| Capacity | 3,000 L/hour × 8 h/day × 300 days × 95% = 6,840,000 L/year | Calculated planning assumption | Medium | Revenue |
| Selling price | USD 0.55/L | Blended ex-factory planning assumption | Low-medium | Revenue and margin |
| Variable cost | USD 0.34/L | Ingredients, packaging, utilities, labor and loss | Medium | Gross margin |
| Total investment | $1.43m | Budgetary machinery and factory allowance | Medium | NPV and funding |
| Financing | 40% equity, 60% debt, 9%, five years | Analyst assumption | Low-medium | Cash flow |
| Tax and discount | 20% tax, 12% discount | Planning assumption | Low-medium | NPV and net profit |
Source Register
| Ref | Organization | Source and URL | Data used | Access date | Confidence |
|---|---|---|---|---|---|
| [1] | World Bank | World Development Indicators: Manufacturing, value added, https://api.worldbank.org/v2/indicator/NV.IND.MANF.CD | Manufacturing context source | 6 Aug 2026 | High |
| [2] | World Bank | World Development Indicators: Population, total, https://api.worldbank.org/v2/indicator/SP.POP.TOTL | Demand-localization context | 6 Aug 2026 | High |
| [3] | FAO | FAOSTAT crops platform, https://www.fao.org/faostat/en/#data/QCL | Fruit and crop supply localization source | 6 Aug 2026 | High for official agriculture context |
| [4] | Codex Alimentarius | General Standard for Fruit Juices and Nectars CXS 247-2005, https://www.fao.org/fao-who-codexalimentarius | Fruit juice and nectar standard context | 6 Aug 2026 | High |
| [5] | FDA | Juice HACCP, https://www.fda.gov/food/hazard-analysis-critical-control-point-haccp/juice-haccp | Juice safety/HACCP context | 6 Aug 2026 | High for U.S. context |
| [6] | USITC / HTS | Chapter 20 preparations of vegetables, fruit and nuts, https://hts.usitc.gov/reststop/file?release=currentRelease&filename=Chapter%2020 | HS 2009 juice classification caveat | 6 Aug 2026 | High for HS reference |
| [7] | WHO | Healthy diet, https://www.who.int/news-room/fact-sheets/detail/healthy-diet | Sugar and diet context for beverage positioning | 6 Aug 2026 | High |
36. Consultation Section
Need a Localized Juice Production Factory Study?
For a bankable juice production factory report, confirm country, city, product recipes, fruit or concentrate prices, bottle sizes, packaging format, utility tariff, building status, distributor contracts, tax rate, financing terms and supplier quotations. Rolangear can support juice processing line configuration, machinery selection, capacity planning and quote comparison.
Contact Rolangear37. Final Conclusion and Recommendation
The juice production factory is technically feasible and financially positive under the stated budgetary assumptions. The investment is most attractive when the plant secures stable ingredient and packaging supply, validates shelf life, develops retail and HORECA channels, controls returns and maintains food-safety discipline. The recommendation is to proceed to localized validation before final investment: confirm demand, recipes, selling prices, ingredient and packaging costs, building suitability, food regulations and formal supplier quotations.