Tissue Paper Factory Feasibility Study
Tissue Paper Factory Feasibility Study
Professional feasibility study for a small-to-medium tissue paper converting factory producing facial tissue, toilet rolls, napkins, kitchen towels and private-label tissue packs. Because no country, city, raw-material price, utility tariff, building condition or supplier quotation was supplied, this report uses transparent USD planning assumptions that must be localized before investment approval.
Study Map
1. Executive Summary
The project is a tissue paper converting factory that purchases jumbo tissue parent rolls and converts them into facial tissue boxes, toilet paper rolls, napkins, kitchen towels and private-label tissue packs. The base case assumes 600 kg/hour rated converting output, 80% operating efficiency, 10 hours/day, 300 operating days/year and 100% saleable planning yield after normal waste recovery, giving 1,440 tons/year of saleable finished tissue products.

Using a blended ex-factory selling price of USD 2,500/ton, variable cost of USD 1,650/ton and total investment of $1.43m, Year-5 revenue reaches $3.24m and Year-5 net profit reaches $444,778. Base NPV is $61,378 at a 12% discount rate, estimated IRR is 13.5%, and break-even utilization is 39.6%.6%.
2. Study Scope and Methodology
This study covers the full investment-report scope: market, technical, operating, staffing, investment, financing, revenue, financial statements, indicators, break-even, sensitivity, legal, EHS, risk, implementation, sources, consultation and final recommendation. World Bank indicators support macro and demand-localization context [1][2]. HS Chapter 48 supports paper/tissue trade classification caveats [3]. ISO tissue-paper standards, EPA pulp-and-paper context, OSHA paper-machine guarding guidance and EU waste policy provide standards, environmental and safety references [4][5][6][7].
3. Project Concept and Nature
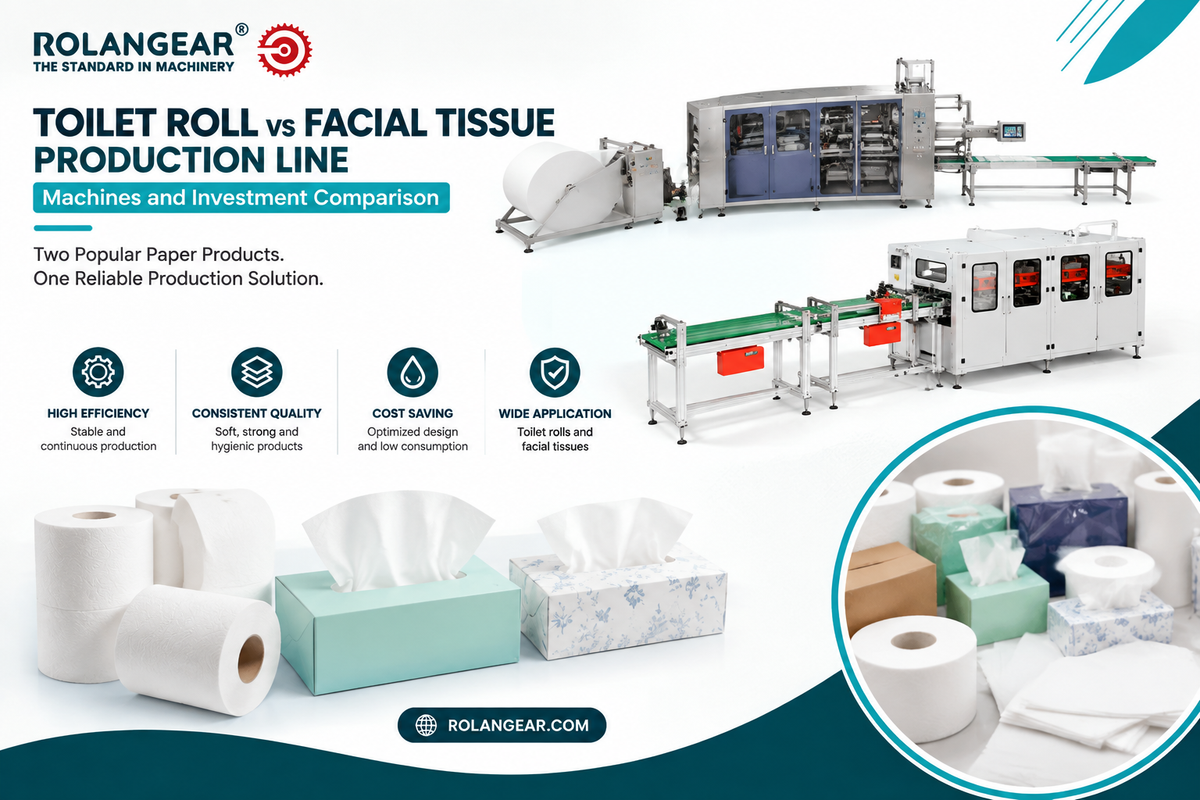
The project is a hygienic paper converting factory, not an integrated pulp-and-paper mill. The plant buys parent rolls from tissue mills or importers, then embosses, rewinds, folds, cuts, interfolds, packs and cartons finished tissue products. The business model can combine local wholesale supply, retail private label, institutional/HORECA supply and distributor sales.
4. Product Analysis and Product-Specification Table

Core product specifications include tissue grade, ply count, grammage, sheet size, roll length, embossing pattern, softness, absorbency, box or film packaging and carton count. Hygiene and product-compliance claims should not be made until raw material, production conditions and local standards are verified.
| Product | Typical specification | Target channel | Quality notes |
|---|---|---|---|
| Facial tissue boxes | 2-ply, 100–200 sheets/box | Retail, offices, hotels | Softness, dust control, box strength |
| Toilet paper rolls | 1–3 ply, multiple roll lengths | Retail and distributors | Sheet strength, perforation, winding firmness |
| Napkins | 1–2 ply, quarter or dispenser fold | Restaurants, cafés, catering | Fold accuracy and pack count |
| Kitchen towels | 2-ply absorbent rolls | Retail and households | Absorbency and roll consistency |
| Private-label tissue packs | Buyer-specific packs and cartons | Supermarkets and distributors | Artwork, barcode, carton and QC approval |
5. Economic Indicators and Project Location
Tissue demand is linked to population, household income, retail development, tourism, hotels, restaurants, schools, healthcare and workplace consumption. World Bank population and manufacturing indicators should be used when localizing the study [1][2]. Location should prioritize clean industrial zoning, access to jumbo rolls and packaging suppliers, retail distribution routes, power reliability and hygienic storage space.
| Factor | Weight | Preferred condition | Effect |
|---|---|---|---|
| Jumbo-roll supply and logistics | 24% | Near paper mills, importers or ports | Controls raw-material cost and stock risk |
| Clean industrial building | 18% | Dust-controlled, dry and pest-controlled space | Protects hygiene and quality |
| Customer route density | 17% | Near retailers, wholesalers, hotels and institutions | Improves delivery economics |
| Electricity and compressed air | 14% | Reliable power for converting and packing | Protects uptime |
| Packaging suppliers | 11% | Cartons, film, boxes and labels available | Reduces stockouts |
| Labor availability | 9% | Operators, packers and maintenance staff | Supports output quality |
| Regulatory clarity | 7% | Clear labeling, hygiene and waste rules | Reduces launch delays |
6. Target-Market Indicators with TAM, SAM and Realistically Obtainable Market Separation
| Layer | Definition | Planning treatment |
|---|---|---|
| TAM | All facial tissue, toilet rolls, napkins, kitchen towels and institutional tissue demand | Not fully available to one project |
| SAM | Demand reachable through planned retailers, distributors and HORECA/institutional customers | Requires local distributor validation |
| Realistically obtainable market | Volume a new converter can win within five years | Limited by brand trust, shelf access and credit terms |
| Project sales forecast | Ramp-up to 1,296 t/y by Year 5 | Capacity-led forecast, not a market-share claim |
7. Demand Analysis

Because no country was supplied, the study uses a capacity-led forecast rather than a national consumption forecast. Formula: 600 kg/hour × 80% efficiency × 10 hours/day × 300 days/year = 1,440 tons/year saleable output. Year-1 sales = 720 tons; Year-5 sales = 1,296 tons. For localization, demand should be calculated using population × annual tissue consumption per person, plus institutional customer counts, apparent consumption and retailer/distributor interviews.
8. Local Production Analysis
Local production analysis should identify integrated tissue mills, parent-roll importers, small converting factories, napkin converters, private-label suppliers, supermarket brands and imported finished tissue. Exact local production is not stated because no country was provided; it should be verified through industrial registries, customs data, distributor interviews and store shelf checks.
9. Import and Export Analysis with HS-Code Caveats
Likely product classifications fall under HS Chapter 48 for paper and paperboard articles. Tissue-related finished goods may be classified under headings such as HS 4818 for toilet paper and similar household or sanitary paper articles, while parent rolls may fall under different paper headings depending on format and national tariff detail [3]. These HS codes can be broad, so trade data must not be treated as exact facial tissue or toilet-roll demand without subheading validation.
10. Competitor Analysis
| Competitor type | Examples to research locally | Pressure | Response |
|---|---|---|---|
| Integrated tissue mills | Mills with converting and brands | High | Compete through service, private label and flexible SKUs |
| Small converters | Local napkin/facial tissue workshops | Medium-high | Improve hygiene, pack quality and delivery |
| Imported finished tissue | Regional brands and importers | Medium | Use faster delivery and local pack customization |
| Private-label suppliers | Converters serving supermarkets | High for retail shelves | Offer reliable specification and packaging approval |
| Substitutes | Cloth towels, hand dryers in institutions | Low-medium | Focus on hygiene and convenience |
11. Market-Gap Analysis

Market gap should be calculated as total tissue demand plus import-replacement potential minus reliable local production, adjusted for brand loyalty and shelf access. In the base model, the factory needs to sell 1,296 tons by Year 5. This must be supported by distributor agreements, supermarket listing discussions and HORECA/institutional customer interviews before final approval.
12. SWOT Analysis
| Strengths | Weaknesses | Opportunities | Threats |
|---|---|---|---|
| Daily-use hygiene product with broad demand | Brand trust and shelf access take time | Private label, HORECA and institutional supply | Jumbo-roll price volatility |
| Moderate converting technology compared with paper milling | Packaging design and QC affect repeat sales | Multiple product formats from shared equipment | Strong existing brands and promotions |
| Scalable SKU mix | Requires clean storage and dust control | Local customization and short lead times | Currency and import-cost exposure |
13. Marketing and Promotional Plan
The marketing plan should focus on distributor onboarding, retail sampling, HORECA/institutional trial packs, private-label proposals, packaging design, consistent pack count and reliable delivery. KPIs include repeat order rate, active outlets, retailer returns, complaint rate, production waste, margin by SKU, delivery fill rate and receivable days.
14. Pricing Plan
| Product | Planning selling price | Pricing logic |
|---|---|---|
| Facial tissue boxes | USD 2,200–2,700/t | Box, ply, sheet count and softness affect price |
| Toilet paper rolls | USD 1,900–2,400/t | Roll length, ply and bundle format drive price |
| Napkins | USD 2,000–2,500/t | Fold, embossing and food-service pack size matter |
| Kitchen towels | USD 2,200–2,800/t | Absorbency and roll size support premium pricing |
| Blended model price | USD 2,500/t | Used for base financial model |
15. Distribution Plan
Distribution should combine wholesale distributors, supermarkets, mini-markets, hotels, restaurants, offices, healthcare/institutional buyers and selected private-label customers. Retail products need packaging, barcode and shelf-display discipline; institutional products need carton strength, volume pricing and delivery reliability.
16. Machinery, Equipment, and Production-Line Costs

Machinery costs are budgetary planning estimates, not supplier quotations. Final cost depends on facial tissue interfold type, toilet roll rewinder speed, napkin folder capacity, automatic packing level, embossing, printing, carton packing, voltage, installation and destination.
| Machine/equipment | Function | Budgetary estimate |
|---|---|---|
| Facial tissue interfolding line | Folds, counts and cuts facial tissue | USD 120k–260k |
| Toilet roll rewinder and log saw | Rewinds parent rolls and cuts finished rolls | USD 130k–280k |
| Napkin folding machine | Folds and embosses napkins | USD 50k–140k |
| Kitchen towel rewinding option | Produces absorbent towel rolls | USD 60k–150k |
| Automatic packing/bundling machines | Film, box, bundle and carton packing | USD 150k–350k |
| Compressor, vacuum, dust control and electrical | Factory support utilities | USD 70k–160k |
| QC tools and handling equipment | GSM, weight, count and warehouse control | USD 20k–60k |
17. Building, Facility, and Construction Costs
The facility should include parent-roll storage, converting hall, packing area, finished-goods warehouse, packaging-material store, dust collection, QC room, maintenance area, staff hygiene area, office and dispatch bay. The base model assumes an existing leased or owned building requiring hygiene fit-out, dust control, electrical distribution, compressed air and warehouse racking.
18. Production Capacity and Line Suitability

Rated output is modeled at 600 kg/hour. Effective output = 600 × 80% = 480 kg/hour. Daily output = 480 × 10 hours = 4.8 tons/day. Annual output = 4.8 × 300 days = 1,440 tons/year. Bottlenecks may occur in parent-roll changeover, folding speed, log-saw cutting, packaging speed, carton availability, dust control and finished-goods storage.
19. Supplier Quotations and Technical Offers
No supplier quotation was provided. Final technical offers should confirm parent-roll width, grammage range, ply compatibility, embossing pattern, folding style, output speed by SKU, packing format, carton pack arrangement, power and compressed-air needs, spare parts, warranty, installation, training and Incoterm.
20. Raw-Material Costs
Main inputs are jumbo tissue parent rolls, cores, cartons, plastic film, printed boxes, labels, glue, inks where used, tape and pallets. The base variable cost is USD 1,650/ton finished tissue, including parent rolls, packaging, direct labor, utilities and normal waste. Parent-roll cost is the largest variable-cost driver.
21. Operating Requirements and Expenses

Annual fixed operating expenses are estimated at $360,000 in Year 1 before depreciation, increasing 3% annually. This covers management, supervisors, QA, maintenance, sales/admin, insurance, security, cleaning, basic marketing, pest control and non-variable overhead.
22. Utility Requirements
| Utility | Requirement to confirm | Effect |
|---|---|---|
| Electricity | 3-phase power for rewinders, folders, packing and conveyors | Controls uptime |
| Compressed air | Packing, cutting and machine actuators | Conversion reliability |
| Dust extraction | Tissue dust collection and housekeeping | Quality and safety |
| Vacuum system | Some folding and transfer operations | Line stability |
| Water and sanitation | Cleaning and staff hygiene | Food/hygiene buyer acceptance |
| Fire safety | Alarms, extinguishers and paper storage separation | High because tissue is combustible |
23. Organizational and Management Structure
| Role | Headcount | Main responsibility |
|---|---|---|
| General manager | 1 | Operations, sales and finance |
| Production supervisor | 2 | Shift output, quality and waste |
| Machine operators | 8 | Interfolding, rewinding, napkin and packing lines |
| Packing operators | 12 | Boxing, bundling, carton packing and palletizing |
| Quality-control technician | 2 | GSM, count, pack, dust and release checks |
| Maintenance/electrician | 3 | Mechanical, electrical and compressed air support |
| Warehouse/dispatch | 4 | Parent rolls, finished goods and loading |
| Sales/admin/accounting | 4 | Orders, invoices, credit and customer service |
24. Investment Costs
| Investment item | Estimate | Basis |
|---|---|---|
| Facial tissue, toilet roll and napkin converting lines | $520,000 | Budgetary equipment package |
| Automatic packing, bundling and carton support | $190,000 | Packaging automation allowance |
| Electrical, compressed air, dust control and utilities | $150,000 | Utility allowance |
| Building hygiene fit-out, warehouse racking and fire safety | $110,000 | Existing-building allowance |
| QC, workshop, handling and IT tools | $100,000 | Support equipment |
| Freight, installation, training and commissioning | $90,000 | Destination-dependent allowance |
| Pre-operating expenses, permits and launch | $45,000 | Planning estimate |
| Contingency reserve | $45,000 | Approximate reserve |
| Initial working capital | $180,000 | Parent rolls, packaging and receivables |
| Total project investment | $1.43m | Calculated subtotal |
25. Financing Requirements and Conditions
Base financing assumes 40% equity and 60% debt. Equity requirement is $572,000 and loan requirement is $858,000. Loan terms are modeled at 9% annual interest, five-year equal principal repayment and no grace period. Final terms depend on lender, collateral, country risk and confirmed investment scope.
26. Revenue and Sales Forecasts
| Year | Utilization | Sales volume, tons | Revenue | Gross profit | EBITDA | Net profit | DSCR |
|---|---|---|---|---|---|---|---|
| Y1 | 50.0% | 720 | $1.80m | $612,000 | $252,000 | $39,824 | 0.97x |
| Y2 | 65.0% | 936 | $2.34m | $795,600 | $424,800 | $190,419 | 1.62x |
| Y3 | 75.0% | 1,080 | $2.70m | $918,000 | $536,076 | $291,795 | 2.13x |
| Y4 | 85.0% | 1,224 | $3.06m | $1.04m | $647,018 | $392,904 | 2.71x |
| Y5 | 90.0% | 1,296 | $3.24m | $1.10m | $696,417 | $444,778 | 3.13x |
| Scenario | Key assumptions | Y5 sales | Y5 revenue | Interpretation |
|---|---|---|---|---|
| Conservative | 70% utilization; price -6%; parent roll +5% | 1,008 t/y | $2.18m | Marginal; needs contracts and cost control |
| Base case | 90% utilization; USD 2,500/t price | 1,296 t/y | $3.24m | Positive under assumptions |
| Optimistic | 95% utilization; price +5%; strong private label | 1,368 t/y | $3.30m | Strong if shelf access is secured |
27. Financial Statements
| Year | Utilization | Sales volume | Revenue | Gross profit | EBITDA | Net profit | DSCR |
|---|---|---|---|---|---|---|---|
| Y1 | 50.0% | 720 | $1.80m | $612,000 | $252,000 | $39,824 | 0.97x |
| Y2 | 65.0% | 936 | $2.34m | $795,600 | $424,800 | $190,419 | 1.62x |
| Y3 | 75.0% | 1,080 | $2.70m | $918,000 | $536,076 | $291,795 | 2.13x |
| Y4 | 85.0% | 1,224 | $3.06m | $1.04m | $647,018 | $392,904 | 2.71x |
| Y5 | 90.0% | 1,296 | $3.24m | $1.10m | $696,417 | $444,778 | 3.13x |
| Year | Operating cash flow | Debt principal repayment | Levered cash flow | Cumulative equity cash flow | Closing debt |
|---|---|---|---|---|---|
| Y1 | $164,824 | $171,600 | $-6,776 | $-578,776 | $686,400 |
| Y2 | $315,419 | $171,600 | $143,819 | $-434,957 | $514,800 |
| Y3 | $416,795 | $171,600 | $245,195 | $-189,762 | $343,200 |
| Y4 | $517,904 | $171,600 | $346,304 | $156,543 | $171,600 |
| Y5 | $569,778 | $171,600 | $398,178 | $554,721 | $0 |
| Year | Net fixed assets | Inventory | Receivables | Cash | Total assets | Payables | Loan balance | Equity + retained earnings | Liabilities + equity |
|---|---|---|---|---|---|---|---|---|---|
| Y1 | $1.12m | $97,644 | $197,260 | $-40,310 | $1.38m | $81,370 | $686,400 | $611,824 | $1.38m |
| Y2 | $1.00m | $126,937 | $256,438 | $39,449 | $1.42m | $105,781 | $514,800 | $802,243 | $1.42m |
| Y3 | $875,000 | $146,466 | $295,890 | $241,937 | $1.56m | $122,055 | $343,200 | $1.09m | $1.56m |
| Y4 | $750,000 | $165,995 | $335,342 | $545,534 | $1.80m | $138,329 | $171,600 | $1.49m | $1.80m |
| Y5 | $625,000 | $175,759 | $355,068 | $922,359 | $2.08m | $146,466 | $0 | $1.93m | $2.08m |
28. Financial Indicators and Financial Analysis
| Indicator | Formula / basis | Base result | Interpretation |
|---|---|---|---|
| Gross margin | Revenue minus COGS divided by revenue | 34.0% | Healthy if parent-roll cost is controlled |
| Contribution margin | Selling price minus variable cost | USD 850/ton | Used for break-even |
| Break-even quantity | Fixed cost + depreciation divided by contribution | 571 tons/year | Requires 39.6% utilization |
| ROI | Average net profit divided by investment | 19.0% | Positive after ramp-up |
| NPV | Unlevered cash flow discounted at 12% | $61,378 | Positive but sensitive to selling price and parent-roll cost |
| IRR | Discount rate where NPV equals zero | 13.5% | Above the 12% hurdle rate |
| Payback | Cumulative levered equity cash recovery | During Year 4 | Depends on working capital |
| Debt-to-equity | Debt divided by equity | 1.50x | Moderate leverage |
| Minimum cash requirement | Initial working capital | $180,000 | Needed for jumbo rolls and receivables |
29. Break-Even Analysis
Contribution per ton = 2,500 − 1,650 = 850 USD/ton. Break-even quantity = fixed cost plus depreciation ($485,000) ÷ contribution = 571 tons/year. Break-even revenue = $1.43m and break-even utilization = 39.6% of annual saleable capacity.
Source: calculated base-case model, 2026. Unit: percent of annual saleable capacity.
30. Sensitivity Analysis
| Variable tested | NPV impact | Criticality |
|---|---|---|
| Selling price -10% | $-356,000 | High |
| Jumbo-roll tissue cost +10% | $-302,000 | High |
| Sales utilization -10% | $-188,000 | High |
| Packaging cost +10% | $-56,000 | Medium |
| Labor +10% | $-62,000 | Medium |
| Electricity +10% | $-33,000 | Medium |
| Capital cost +10% | $-143,000 | Medium |
| Interest +2 pts | $-31,000 | Medium |
| Launch delay 6 months | $-170,000 | High |
| Selling price +10% | $356,000 | High |
Source: calculated sensitivity model, 2026. Unit: USD impact on NPV.
Critical-variable ranking: selling price, parent-roll cost, utilization, launch delay and capital cost are the main viability drivers.
31. Legal and Regulatory Requirements
Requirements normally include company registration, industrial license, environmental approval, fire-safety approval, worker safety rules, tax registration, labeling rules, waste-management procedure and packaging rules. Tissue products may need local hygiene, labeling and product-safety review. ISO 12625 standards provide tissue-paper test and terminology references but do not replace local certification [4].
32. Environmental, Health, and Safety Analysis

EHS issues include tissue dust, fire load, machine nip points, rotating shafts, log saws, blades, compressed air, lifting of parent rolls, noise, packaging waste and housekeeping. Paper-machine guarding and safe isolation are important safety principles [6]. EPA pulp-and-paper references are more relevant to integrated mills, but converting factories still need waste, dust and fire controls [5].
33. Risk Analysis and Risk Register
| Risk | Probability | Impact | Mitigation |
|---|---|---|---|
| Jumbo-roll price increase | High | High | Supplier contracts and price-adjustment terms |
| Slow retail listing | Medium | High | Distributor agreements and private-label trials before launch |
| Packaging shortage | Medium | Medium-high | Multiple carton, film and box suppliers |
| High production waste | Medium | Medium | Operator training and QC checks |
| Dust or fire incident | Low-medium | High | Dust extraction, fire safety and housekeeping |
| Strong brand competition | High | Medium-high | Focus on private label, institutional channels and reliable delivery |
| Receivable delay | Medium | Medium | Credit limits, deposits and collection controls |
34. Implementation Schedule
| Phase | Duration | Key tasks |
|---|---|---|
| Feasibility localization | 2–4 weeks | Country data, jumbo-roll prices, customer interviews and SKU plan |
| Engineering, permits and quotations | 1–2 months | Layout, permits, utilities and supplier offers |
| Procurement and manufacturing | 2–3 months | Machine order, packing format and shipment |
| Civil works and utilities | 2–3 months | Electrical, compressed air, dust control and warehouse setup |
| Installation and commissioning | 4–6 weeks | Machine installation, training and trial production |
| Commercial launch | 1 month | Sampling, distributor onboarding and first orders |
Source: implementation planning assumption, 2026. Unit: months.
Data-Driven Charts
Source: calculated base-case model, 2026. Unit: USD million.
Source: calculated base-case model, 2026. Unit: USD thousand.
Source: ramp-up assumption, 2026. Unit: percent.
Source: investment model, 2026. Unit: USD.
Source: cost-structure assumption, 2026. Unit: share of variable cost.
Source: debt schedule, 2026. Unit: USD thousand.
35. Sources and Assumptions
Assumptions Register
| Assumption | Value | Basis | Confidence | Effect |
|---|---|---|---|---|
| Currency | USD | Analyst assumption | Medium | All outputs |
| Capacity | 600 kg/h × 80% × 10 h/day × 300 days | Calculated assumption | Medium | Revenue |
| Saleable output | 1,440 t/y | Calculated | Medium | Forecast |
| Selling price | USD 2,500/t | Planning assumption | Low-medium | Revenue and margin |
| Variable cost | USD 1,650/t | Parent rolls, packaging, labor, utilities and waste | Medium | Gross margin |
| Total investment | $1.43m | Budgetary machinery and factory allowance | Medium | NPV and funding |
| Financing | 40% equity, 60% debt, 9%, five years | Analyst assumption | Low-medium | Cash flow |
| Tax and discount | 20% tax, 12% discount | Planning assumption | Low-medium | NPV and net profit |
Source Register
| Ref | Organization | Source and URL | Data used | Access date | Confidence |
|---|---|---|---|---|---|
| [1] | World Bank | World Development Indicators: Manufacturing, value added, https://api.worldbank.org/v2/indicator/NV.IND.MANF.CD | Manufacturing context source | 6 Aug 2026 | High |
| [2] | World Bank | World Development Indicators: Population, total, https://api.worldbank.org/v2/indicator/SP.POP.TOTL | Demand-localization context | 6 Aug 2026 | High |
| [3] | USITC / HTS | Chapter 48 paper and paperboard, https://hts.usitc.gov/reststop/file?release=currentRelease&filename=Chapter%2048 | HS Chapter 48 classification caveat | 6 Aug 2026 | High for HS reference |
| [4] | ISO | ISO 12625 tissue paper and tissue products reference, https://www.iso.org/standard/72350.html | Tissue standards context | 6 Aug 2026 | Medium-high; standard purchase may be required |
| [5] | U.S. EPA | Pulp and paper production air-pollution resources, https://www.epa.gov/stationary-sources-air-pollution | Environmental context for paper industry | 6 Aug 2026 | Medium; more relevant to integrated mills |
| [6] | OSHA | Paper machine guarding eTool, https://www.osha.gov/etools/machine-guarding | Machine guarding and safety context | 6 Aug 2026 | High for safety principles |
| [7] | European Commission | Waste Framework Directive, https://environment.ec.europa.eu/topics/waste-and-recycling/waste-framework-directive_en | Waste-policy context | 6 Aug 2026 | High for EU context |
36. Consultation Section
Need a Localized Tissue Paper Factory Study?
For a bankable tissue paper factory report, confirm country, city, jumbo-roll source, product mix, sheet counts, packaging design, utility tariff, building status, customer contracts, tax rate, financing terms and supplier quotations. Rolangear can support tissue converting line configuration, machinery selection, capacity planning and quote comparison.
Contact Rolangear37. Final Conclusion and Recommendation
The tissue paper factory is technically feasible and financially positive under the stated budgetary assumptions. The investment is most attractive when the plant secures reliable jumbo-roll supply, maintains clean converting conditions, develops distributor and private-label channels, controls packaging cost and avoids excessive receivable exposure. The recommendation is to proceed to localized validation before final investment: confirm local demand, selling prices, parent-roll costs, product standards, packaging costs, building suitability, environmental and fire-safety requirements and formal supplier quotations.