Plastic Bag Factory Industrial-Feasibility-Study
Plastic Bag Factory Feasibility Study
Professional feasibility study for a small-to-medium plastic bag factory producing T-shirt shopping bags, flat bags, garbage bags, liner bags and printed retail bags. Because no country, city, resin price, utility tariff, building condition or supplier quotation was supplied, this report uses transparent USD planning assumptions that must be localized before investment approval.
Study Map
1. Executive Summary
The project is a plastic bag manufacturing factory based on blown-film extrusion, optional printing, cutting, sealing, punching, counting and packing. The base case assumes rated output of 400 kg/hour, 85% operating efficiency, 20 hours/day, 300 operating days/year and 95% saleable yield, giving 1,938 tons/year of saleable bags.

Using a blended ex-factory selling price of USD 1,900/ton, variable cost of USD 1,350/ton and total investment of $1.10m, Year-5 revenue reaches $3.31m and Year-5 net profit reaches $391,414. Base NPV is $171,145 at a 12% discount rate, estimated IRR is 17.2%, and break-even utilization is 39.2%.
2. Study Scope and Methodology
This feasibility study covers market, technical, operational, organizational, investment, financing, financial statements, indicators, break-even, sensitivity, legal, EHS, risk, implementation, sources, consultation and final recommendation. World Bank indicators support macro screening [1][2], HS 3923 supports trade-classification caveats [3], and UNEP, OECD, EU and OSHA sources support environmental and safety context [4][5][6][7].
3. Project Concept and Nature
The project is a light-to-medium industrial plastics converting factory. Resin pellets are extruded into film rolls, printed when required, converted into bags, packed and distributed to retail, wholesale, food-service, industrial and institutional customers. The model is mainly domestic packaging supply with import-substitution potential, not a guaranteed export business.
4. Product Analysis and Product-Specification Table

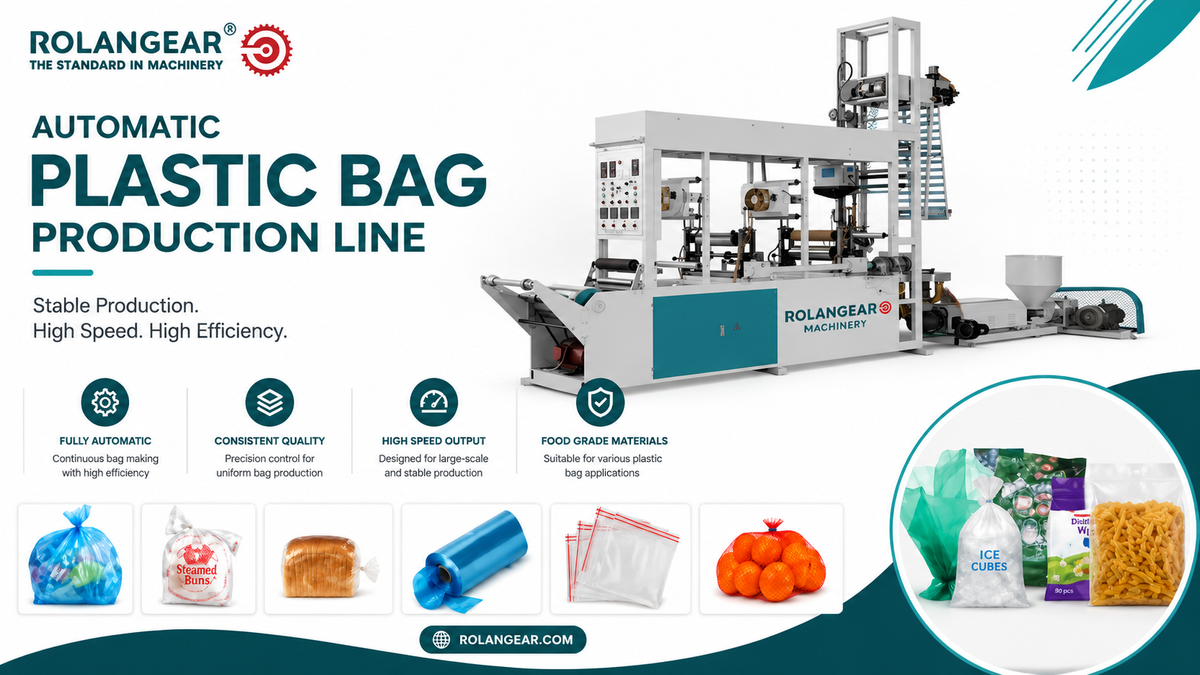
The product mix includes commodity and semi-custom bags. Specifications must be confirmed by size, thickness, resin grade, color, printing, roll or bundle format and allowed plastic-bag category.
| Product | Typical specification | Target customer | Quality notes |
|---|---|---|---|
| T-shirt shopping bags | HDPE/LDPE, 12–35 micron, punched handles | Groceries and retailers | Handle strength, seal quality, count accuracy |
| Flat bags | Clear or colored multiple sizes | Bakeries, textiles, spare-parts shops | Clean sealing and clarity |
| Garbage bags | LDPE/LLDPE roll bags, 30–100 micron | Households, cleaners, institutions | Puncture resistance and roll perforation |
| Liner bags | Large industrial/bin liners | Factories, hotels, warehouses | Load capacity and leak resistance |
| Printed retail bags | 1–4 color flexographic print | Retail chains/private labels | Ink adhesion and registration |
5. Economic Indicators and Project Location
Plastic bag demand follows retail activity, food-service volume, waste management, manufacturing output and packaging distribution. World Bank manufacturing value-added and population data should be used once a country is selected [1][2].
| Factor | Weight | Preferred condition | Effect |
|---|---|---|---|
| Resin supply and logistics | 24% | Near resin distributors or ports | Controls material cost and working capital |
| Electricity reliability | 20% | Stable 3-phase power | Protects extrusion uptime |
| Industrial zoning | 16% | Approved light-industry zone | Reduces licensing risk |
| Customer route density | 14% | Near retailers and distributors | Improves delivery cost |
| Labor and maintenance | 10% | Available operators and technicians | Supports shifts |
| Waste/recycling ecosystem | 9% | Scrap buyers or in-house recycling | Improves yield |
| Expansion space | 7% | Room for second line | Supports growth |
6. Target-Market Indicators with TAM, SAM and Realistically Obtainable Market Separation
| Layer | Definition | Planning treatment |
|---|---|---|
| TAM | All local flexible plastic packaging, retail bags, garbage bags and liners | Not fully available to the project |
| SAM | Customers reachable by the factory sales team and delivery routes | Validate with local distributors |
| Realistically obtainable market | Volume a new entrant can win in five years | Limited by contracts, credit and quality |
| Project sales forecast | Ramp-up to 1,744 t/y by Year 5 | Capacity-led forecast, not market-share claim |
7. Demand Analysis
Because no country was supplied, this report uses capacity-led demand. Formula: 400 kg/hour × 85% efficiency × 20 hours/day × 300 days/year × 95% yield = 1,938 tons/year. Year-1 sales are 969 tons and Year-5 sales are 1,744 tons. Local demand must later be checked using apparent consumption: local production + imports − exports, plus interviews with retailers, food-service buyers and packaging distributors.
8. Local Production Analysis

Local production analysis should identify blown-film factories, converters, flexible-packaging printers, recycled-bag producers, informal producers and large packaging groups. Commodity bags usually face strong price competition; printed retail bags, garbage bags and institutional liners can improve margin if quality is consistent.
9. Import and Export Analysis with HS-Code Caveats
Likely classification includes HS 3923 for plastic articles for conveyance or packing of goods; bags and sacks are commonly captured under HS 3923.21 or 3923.29 depending on polymer and national tariff schedule [3]. HS 3923 is broad and may include boxes, sacks, bags, closures and other packaging articles, so trade data must not be treated as exact shopping-bag demand without subheading validation.
10. Competitor Analysis
| Competitor type | Examples to research locally | Pressure | Response |
|---|---|---|---|
| Large flexible-packaging plants | Integrated film, print and bag factories | High | Compete through lead time and niche sizes |
| Small bag converters | Local extruder/cutter workshops | High | Improve consistency and delivery |
| Imported finished bags | Regional suppliers and traders | Medium-high | Offer local inventory and custom jobs |
| Substitutes | Paper, woven and reusable bags | Medium | Diversify into permitted gauges and liners |
| New entrants | Used-machine operators | Medium | Secure resin and customers early |
11. Market-Gap Analysis

The market gap should equal estimated demand minus reliable local supply, adjusted for imports, exports, restricted product categories and substitution. In this preliminary model, the project needs to sell 1,744 tons by Year 5; this must be validated with distributor purchase commitments and retail-chain sampling.
12. SWOT Analysis
| Strengths | Weaknesses | Opportunities | Threats |
|---|---|---|---|
| Simple process and broad customer base | Commodity margins can be thin | Private-label and garbage bags improve mix | Plastic restrictions may reduce some bags |
| Scrap can be reprocessed if clean | Resin price volatility | Import substitution and fast local delivery | Low-cost competitors |
| Scalable machinery | Needs reliable electricity and skilled operators | Recycled-content or permitted thicker bags | Environmental compliance burden |
13. Marketing and Promotional Plan
Marketing should focus on distributor onboarding, retail-chain sampling, printed-bag mockups, fast custom-size turnaround, delivery reliability and credit discipline. KPIs include repeat orders, rejected rolls, scrap rate, on-time delivery, SKU margin and receivable days.
14. Pricing Plan
| Product | Planning selling price | Pricing logic |
|---|---|---|
| T-shirt bags | USD 1,700–2,000/t | Price-sensitive and gauge-dependent |
| Flat bags | USD 1,800–2,150/t | Size, clarity and packing matter |
| Garbage bags | USD 1,850–2,350/t | Strength and roll quality drive value |
| Printed retail bags | USD 2,150–2,750/t | Print colors, ink and MOQ affect price |
| Blended model price | USD 1,900/t | Used for base financial model |
15. Distribution Plan
Distribution should combine direct B2B sales to large buyers with wholesale coverage for standard SKUs. Printed bags require artwork approval, deposits and production scheduling. New customers should receive strict credit limits until payment history is proven.
16. Machinery, Equipment, and Production-Line Costs

Machinery costs are budgetary planning estimates, not supplier quotations. Final offers must confirm output width, thickness range, die size, printer colors, sealing speed, power load, spare parts and installation scope.
| Machine/equipment | Function | Budgetary estimate |
|---|---|---|
| Blown-film extrusion line | Forms film rolls | USD 140k–260k |
| Bag cutting and sealing machines | Converts rolls into bags | USD 80k–180k |
| Punching/counting units | Handle punching and bundles | USD 25k–70k |
| Flexographic printer, optional | Printed bag production | USD 70k–160k |
| Scrap grinder/recycling support | Reprocesses clean scrap | USD 25k–80k |
| Compressor/chiller/electrical | Factory utilities | USD 40k–90k |
| QC tools | Thickness, weight and seal checks | USD 8k–25k |
17. Building, Facility, and Construction Costs
The facility should include resin storage, extrusion hall, roll storage, printing zone if installed, cutting/sealing zone, finished goods warehouse, scrap handling, QC room, maintenance area, office and loading bay. The base case assumes an existing industrial building with fit-out, not land purchase.
18. Production Capacity and Line Suitability

Effective output = 400 kg/hour × 85% = 340 kg/hour. Daily output = 340 × 20 hours = 6.8 tons/day. Annual gross output = 6.8 × 300 = 2,040 tons/year. Saleable output after 95% yield = 1,938 tons/year. Bottlenecks can occur in gauge changes, printing setup, cooling stability, sealing speed and roll handling.
19. Supplier Quotations and Technical Offers
No supplier quotation was provided. Final technical offers should confirm resin grades, maximum layflat width, thickness range, output by thickness, printer color count, servo control, sealing width, bag length range, power load, warranty, spare parts, training and Incoterm.
20. Raw-Material Costs
Main inputs are HDPE, LDPE, LLDPE, masterbatch, ink, solvent or water-based ink system, cores, cartons, strapping and labels. Base variable cost is USD 1,350/ton finished bags, including resin, additives, direct labor, power, scrap and direct packing. Resin is the main margin driver.
21. Operating Requirements and Expenses

Annual fixed operating expenses are estimated at $320,000 in Year 1 before depreciation, increasing 3% annually. This covers management, supervision, QA, maintenance, sales/admin, insurance, security, basic marketing and overhead.
22. Utility Requirements
| Utility | Requirement to confirm | Effect |
|---|---|---|
| Electricity | 3-phase supply for heaters, motors and sealers | Major uptime and cost driver |
| Compressed air | Punching/sealing controls | Conversion reliability |
| Cooling/chiller | Bubble and film stability | Quality and speed |
| Ventilation | Heat and ink odor control | Labor comfort and EHS |
| Fire safety | Alarms, extinguishers and storage separation | Inventory risk control |
| Waste handling | Clean scrap segregation and disposal | Compliance and yield |
23. Organizational and Management Structure
| Role | Headcount | Main responsibility |
|---|---|---|
| General manager | 1 | Operations, sales and finance |
| Production supervisors | 2 | Shift output, scrap and operators |
| Extruder operators | 4 | Film extrusion and gauge control |
| Cutting/sealing operators | 6 | Bag conversion and packing |
| Printing operators | 2 | Artwork and print quality |
| QC technician | 1 | Thickness, weight and seal checks |
| Maintenance/electrician | 2 | Mechanical and electrical support |
| Warehouse/dispatch | 3 | Receiving, storage and loading |
| Sales/admin/accounting | 3 | Orders, invoices and customer service |
24. Investment Costs
| Investment item | Estimate | Basis |
|---|---|---|
| Extrusion and bag-making line | $420,000 | Budgetary equipment package |
| Printing/punching auxiliary option | $120,000 | Improves product mix |
| Electrical, compressor, cooling and ventilation | $130,000 | Utility allowance |
| Building fit-out, racking and fire safety | $100,000 | Existing-building allowance |
| QC, workshop, handling and IT | $90,000 | Support equipment |
| Freight, installation and commissioning | $70,000 | Destination-dependent |
| Pre-operating, permits and launch | $35,000 | Planning estimate |
| Contingency reserve | $45,000 | Approximate reserve |
| Initial working capital | $120,000 | Resin, inventory and receivables |
| Total project investment | $1.10m | Calculated subtotal |
25. Financing Requirements and Conditions
Base financing assumes 40% equity and 60% debt. Equity requirement is $440,000 and loan requirement is $660,000. Loan terms are modeled at 9% annual interest, five-year equal principal repayment and no grace period.
26. Revenue and Sales Forecasts
| Year | Utilization | Sales volume, tons | Revenue | Gross profit | EBITDA | Net profit | DSCR |
|---|---|---|---|---|---|---|---|
| Y1 | 50.0% | 969 | $1.84m | $532,950 | $212,950 | $44,440 | 1.05x |
| Y2 | 65.0% | 1,260 | $2.39m | $692,835 | $363,235 | $174,172 | 1.78x |
| Y3 | 75.0% | 1,454 | $2.76m | $799,425 | $459,937 | $261,038 | 2.35x |
| Y4 | 85.0% | 1,647 | $3.13m | $906,015 | $556,342 | $347,666 | 3.01x |
| Y5 | 90.0% | 1,744 | $3.31m | $959,310 | $599,147 | $391,414 | 3.48x |
| Scenario | Key assumptions | Y5 sales | Y5 revenue | Interpretation |
|---|---|---|---|---|
| Conservative | 70% utilization; price -6%; resin +5% | 1,357 t/y | $2.43m | Marginal; requires correction |
| Base case | 90% utilization; USD 1,900/t price | 1,744 t/y | $3.31m | Positive under assumptions |
| Optimistic | 95% utilization; price +5%; stable resin | 1,841 t/y | $3.67m | Strong if contracts are secured |
27. Financial Statements
| Year | Utilization | Sales volume | Revenue | Gross profit | EBITDA | Net profit | DSCR |
|---|---|---|---|---|---|---|---|
| Y1 | 50.0% | 969 | $1.84m | $532,950 | $212,950 | $44,440 | 1.05x |
| Y2 | 65.0% | 1,260 | $2.39m | $692,835 | $363,235 | $174,172 | 1.78x |
| Y3 | 75.0% | 1,454 | $2.76m | $799,425 | $459,937 | $261,038 | 2.35x |
| Y4 | 85.0% | 1,647 | $3.13m | $906,015 | $556,342 | $347,666 | 3.01x |
| Y5 | 90.0% | 1,744 | $3.31m | $959,310 | $599,147 | $391,414 | 3.48x |
| Year | Operating cash flow | Debt principal repayment | Levered cash flow | Cumulative equity cash flow | Closing debt |
|---|---|---|---|---|---|
| Y1 | $142,440 | $132,000 | $10,440 | $-429,560 | $528,000 |
| Y2 | $272,172 | $132,000 | $140,172 | $-289,388 | $396,000 |
| Y3 | $359,038 | $132,000 | $227,038 | $-62,350 | $264,000 |
| Y4 | $445,666 | $132,000 | $313,666 | $251,315 | $132,000 |
| Y5 | $489,414 | $132,000 | $357,414 | $608,729 | $0 |
| Year | Net fixed assets | Inventory | Receivables | Cash | Total assets | Payables | Loan balance | Equity + retained earnings | Liabilities + equity |
|---|---|---|---|---|---|---|---|---|---|
| Y1 | $882,000 | $89,599 | $176,544 | $-64,024 | $1.08m | $71,679 | $528,000 | $484,440 | $1.08m |
| Y2 | $784,000 | $116,479 | $229,507 | $17,809 | $1.15m | $93,183 | $396,000 | $658,612 | $1.15m |
| Y3 | $686,000 | $134,399 | $264,816 | $205,954 | $1.29m | $107,519 | $264,000 | $919,650 | $1.29m |
| Y4 | $588,000 | $152,319 | $300,125 | $480,727 | $1.52m | $121,855 | $132,000 | $1.27m | $1.52m |
| Y5 | $490,000 | $161,279 | $317,779 | $818,695 | $1.79m | $129,023 | $0 | $1.66m | $1.79m |
28. Financial Indicators and Financial Analysis
| Indicator | Formula / basis | Base result | Interpretation |
|---|---|---|---|
| Gross margin | Revenue minus COGS divided by revenue | 28.9% | Acceptable if resin is controlled |
| Contribution margin | Selling price minus variable cost | USD 550/ton | Used for break-even |
| Break-even quantity | Fixed cost + depreciation divided by contribution | 760 tons/year | Requires 39.2% utilization |
| ROI | Average net profit divided by investment | 22.2% | Positive after ramp-up |
| NPV | Unlevered cash flow discounted at 12% | $171,145 | Positive but sensitive |
| IRR | Discount rate where NPV equals zero | 17.2% | Above 12% hurdle rate |
| Payback | Cumulative levered equity cash recovery | During Year 4 | Depends on receivables |
| Debt-to-equity | Debt divided by equity | 1.50x | Moderate leverage |
| Minimum cash requirement | Initial working capital | $120,000 | Stress-test for resin purchases |
29. Break-Even Analysis
Contribution per ton = 1,900 − 1,350 = 550 USD/ton. Break-even quantity = fixed cost plus depreciation ($418,000) ÷ contribution = 760 tons/year. Break-even revenue = $1.44m and break-even utilization = 39.2%.
Source: calculated base-case model, 2026. Unit: percent of annual saleable capacity.
30. Sensitivity Analysis
| Variable tested | NPV impact | Criticality |
|---|---|---|
| Selling price -10% | $-420,000 | High |
| Resin cost +10% | $-285,000 | High |
| Sales utilization -10% | $-222,000 | High |
| Launch delay 6 months | $-190,000 | High |
| Capital cost +10% | $-110,000 | Medium |
| Labor +10% | $-51,000 | Medium |
| Electricity +10% | $-38,000 | Medium |
| Interest +2 pts | $-26,000 | Medium |
| Selling price +10% | $420,000 | High |
Source: calculated sensitivity model, 2026. Unit: USD impact on NPV.
Critical-variable ranking: selling price, resin cost, utilization and launch delay are the strongest viability drivers.
31. Legal and Regulatory Requirements
Requirements normally include company registration, industrial license, environmental approval, fire-safety approval, worker safety rules, tax registration, waste-management procedures and product-labeling obligations. Many countries restrict single-use plastic bags by thickness, recycled content, fees or bans. EU packaging rules show the direction of stronger packaging-waste regulation, but national law controls actual obligations [6].
32. Environmental, Health, and Safety Analysis

EHS issues include hot extruder surfaces, nip points, cutters, sealing bars, lifting resin sacks, fire load from plastic inventory, ink or solvent handling, fumes, noise and scrap management. OSHA plastics-industry guidance highlights machine guarding, ergonomics, ventilation and lockout practices [7].
33. Risk Analysis and Risk Register
| Risk | Probability | Impact | Mitigation |
|---|---|---|---|
| Resin price increase | High | High | Supply contracts and price-adjustment clauses |
| Plastic restrictions | Medium | High | Shift to permitted gauges, liners and reusable formats |
| Competitor price pressure | High | Medium-high | Quality, delivery and service differentiation |
| Power interruption | Medium | High | Confirm supply and backup options |
| High scrap rate | Medium | Medium-high | Training and process controls |
| Receivable delays | Medium | Medium | Credit limits and deposits |
| Fire/EHS incident | Low-medium | High | Fire safety and housekeeping |
34. Implementation Schedule
| Phase | Duration | Key tasks |
|---|---|---|
| Feasibility localization | 2–4 weeks | Country data, resin prices, regulations and customer interviews |
| Engineering, permits and quotations | 1–2 months | Layout, power load, permits and supplier offers |
| Procurement and manufacturing | 2–3 months | Machine order, tooling and shipping |
| Civil works and utilities | 2–3 months | Electrical, compressor, cooling, ventilation and warehouse setup |
| Installation and commissioning | 4–6 weeks | Machine installation, film trials and training |
| Commercial launch | 1 month | Sampling, first orders and receivable control |
Source: implementation planning assumption, 2026. Unit: months.
Data-Driven Charts
Source: calculated base-case model, 2026. Unit: USD million.
Source: calculated base-case model, 2026. Unit: USD thousand.
Source: ramp-up assumption, 2026. Unit: percent.
Source: investment model, 2026. Unit: USD.
Source: cost-structure assumption, 2026. Unit: share of variable cost.
Source: debt schedule, 2026. Unit: USD thousand.
35. Sources and Assumptions
Assumptions Register
| Assumption | Value | Basis | Confidence | Effect |
|---|---|---|---|---|
| Currency | USD | Analyst assumption | Medium | All outputs |
| Capacity | 400 kg/h × 85% × 20 h/day × 300 days × 95% | Calculated assumption | Medium | Revenue |
| Saleable output | 1,938 t/y | Calculated | Medium | Forecast |
| Selling price | USD 1,900/t | Planning assumption | Low-medium | Revenue and margin |
| Variable cost | USD 1,350/t | Resin, additives, labor, power and packing | Medium | Gross margin |
| Total investment | $1.10m | Budgetary machinery and factory allowance | Medium | NPV and funding |
| Financing | 40% equity, 60% debt, 9%, five years | Analyst assumption | Low-medium | Cash flow |
| Tax and discount | 20% tax, 12% discount | Planning assumption | Low-medium | NPV and net profit |
Source Register
| Ref | Organization | Source and URL | Data used | Access date | Confidence |
|---|---|---|---|---|---|
| [1] | World Bank | World Development Indicators: Manufacturing, value added, https://api.worldbank.org/v2/indicator/NV.IND.MANF.CD | Macro/manufacturing screening source | 6 Aug 2026 | High |
| [2] | World Bank | World Development Indicators: Population, total, https://api.worldbank.org/v2/indicator/SP.POP.TOTL | Demand-localization context | 6 Aug 2026 | High |
| [3] | USITC / HTS | Chapter 39 plastics and articles, https://hts.usitc.gov/reststop/file?release=currentRelease&filename=Chapter%2039 | HS 3923 classification caveat | 6 Aug 2026 | High for HS reference |
| [4] | UNEP | Plastic pollution, https://www.unep.org/plastic-pollution | Environmental policy context | 6 Aug 2026 | Medium-high |
| [5] | OECD | Plastics policy resources, https://www.oecd.org/environment/plastics/ | Global plastics context | 6 Aug 2026 | Medium-high |
| [6] | European Commission | Packaging waste, https://environment.ec.europa.eu/topics/waste-and-recycling/packaging-waste_en | Packaging-waste regulatory context | 6 Aug 2026 | High for EU context |
| [7] | OSHA | Plastics Industry - Hazards and Solutions, https://www.osha.gov/plastic-industry/hazards-solutions | Safety hazard context | 6 Aug 2026 | High |
36. Consultation Section
Need a Localized Plastic Bag Factory Study?
For a bankable plastic bag factory report, confirm country, city, allowed bag thickness, target product mix, resin price, utility tariff, building status, customer contracts, printing requirement, recycling plan, tax rate, financing terms and supplier quotations. Rolangear can support production-line configuration, machinery selection, capacity planning and quote comparison.
Contact Rolangear37. Final Conclusion and Recommendation
The plastic bag factory is technically feasible and financially positive under the stated planning assumptions. The model is most attractive when the plant secures reliable resin supply, focuses on permitted bag categories, maintains low scrap, signs distributor or retailer commitments and controls receivable days. The recommendation is to proceed to localized validation before final investment: confirm plastic-bag regulations, local selling prices, resin and masterbatch costs, electricity reliability, building suitability, environmental permit requirements and formal supplier quotations.